
In my previous post I talked about how we can now query Azure Resource Graph data with Log Analytics. The purpose of that addition was to be able to alert on Azure Resource Graph data with Azure Monitor Alerts. In this post I’ll show exactly what you need to be able to create alerts in Azure Monitor.
TLDR: Example Alerts here. AzureResourceGraph-Examples/Alerts/ResourceGraphAlerting/Alerting.MD at master · scautomation/AzureResourceGraph-Examples · GitHub
Managed Identity
In another previous post I talked about Managed Identity being added to Azure Monitor Alerts. This is a key component that is necessary for this to work. You can use both system assigned and user assigned identities. There are pros and cons to using both. That said, the absolute max permissions your identity needs is read access. So from a security perspective if a bad actor has somehow gained access to the managed identity you are using for alerts, you have bigger problems than them being able to read things with the managed identity. With that information in mind you can choose which type of identity to use. For my purposes I went ahead and created a user assigned MI and then gave it reader access to my subscription and log analytics.
Whatever you choose it needs read access to any resource(s) you want to alert on and a log analytics workspace. For my testing I gave it reader access to my entire subscription because I was testing alerts on all types of resources.
If you were to use a system assigned identity, instead of selecting user assigned and assigning it your existing user assigned identity, you would selected system assigned during alert creation.
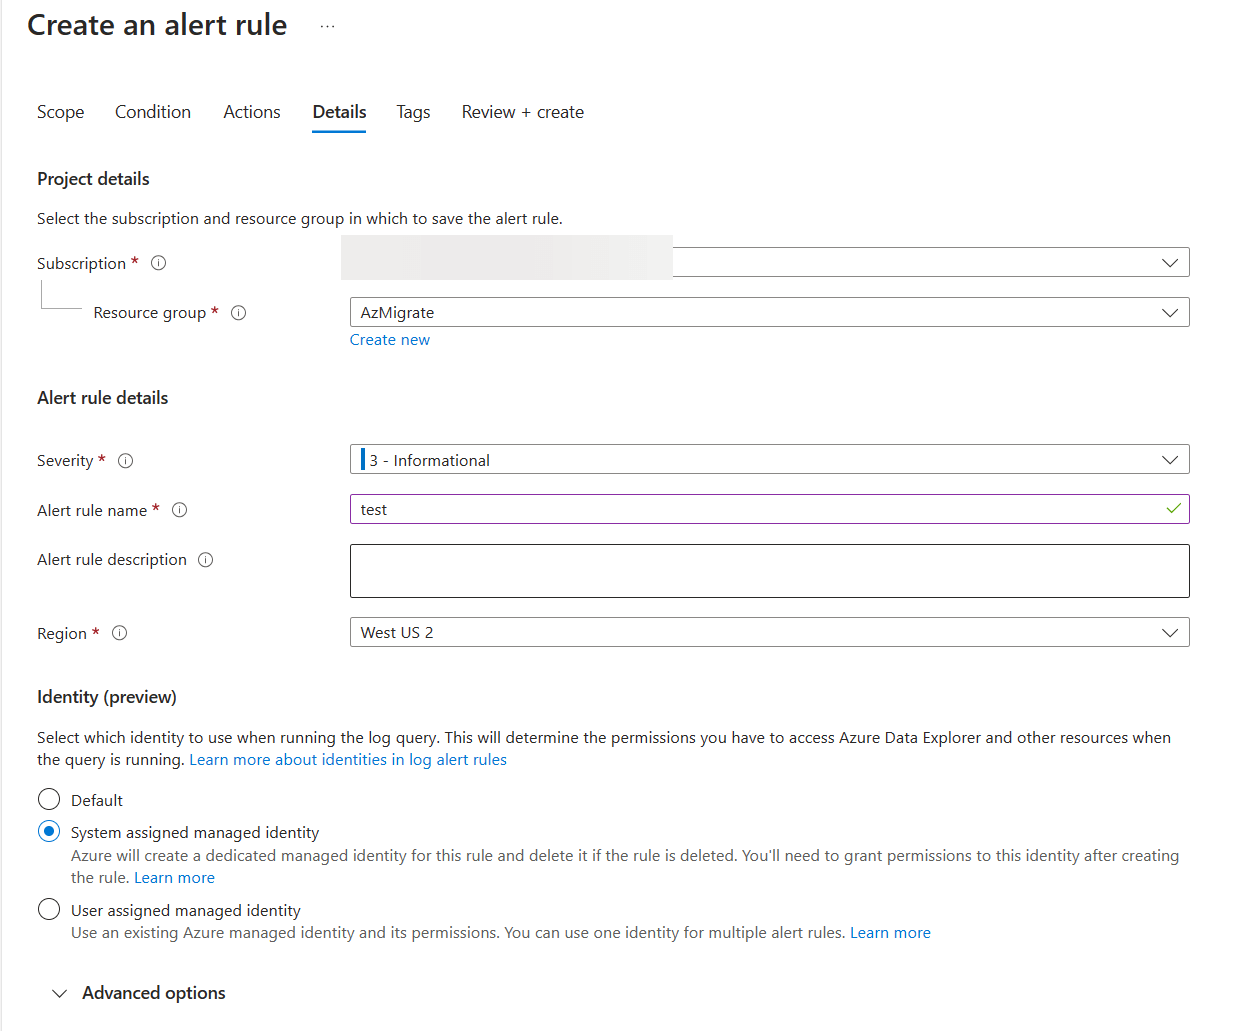
The system would then create a system assigned identity for you during alert creation. You would then need to go back into the alert you just created and go to identity.
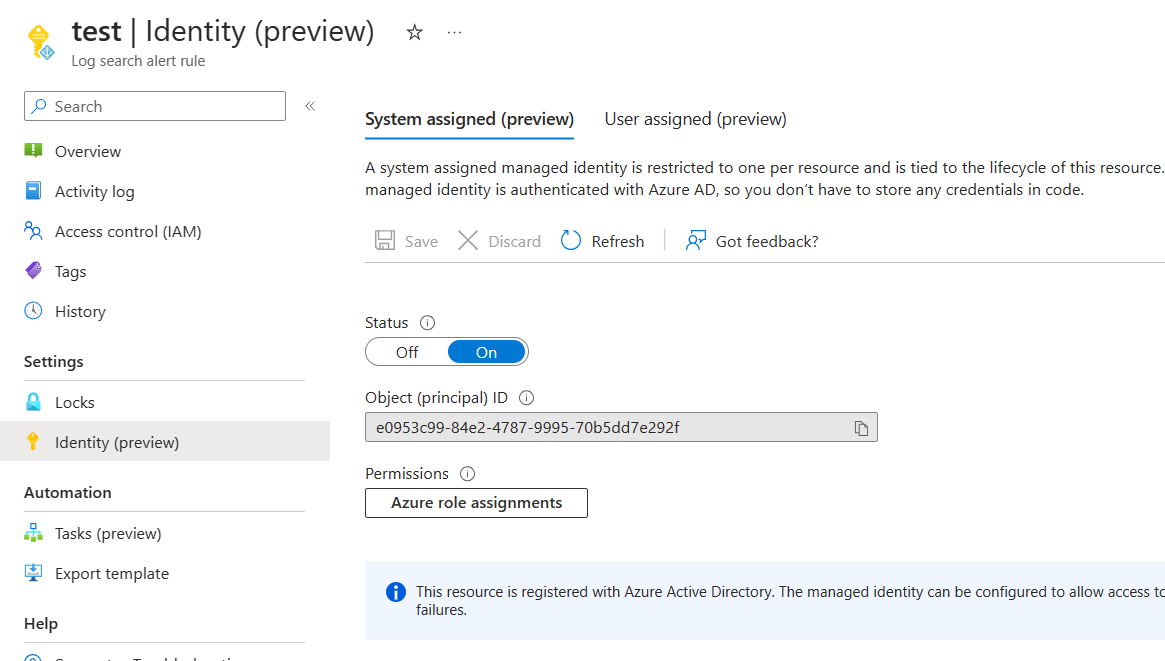
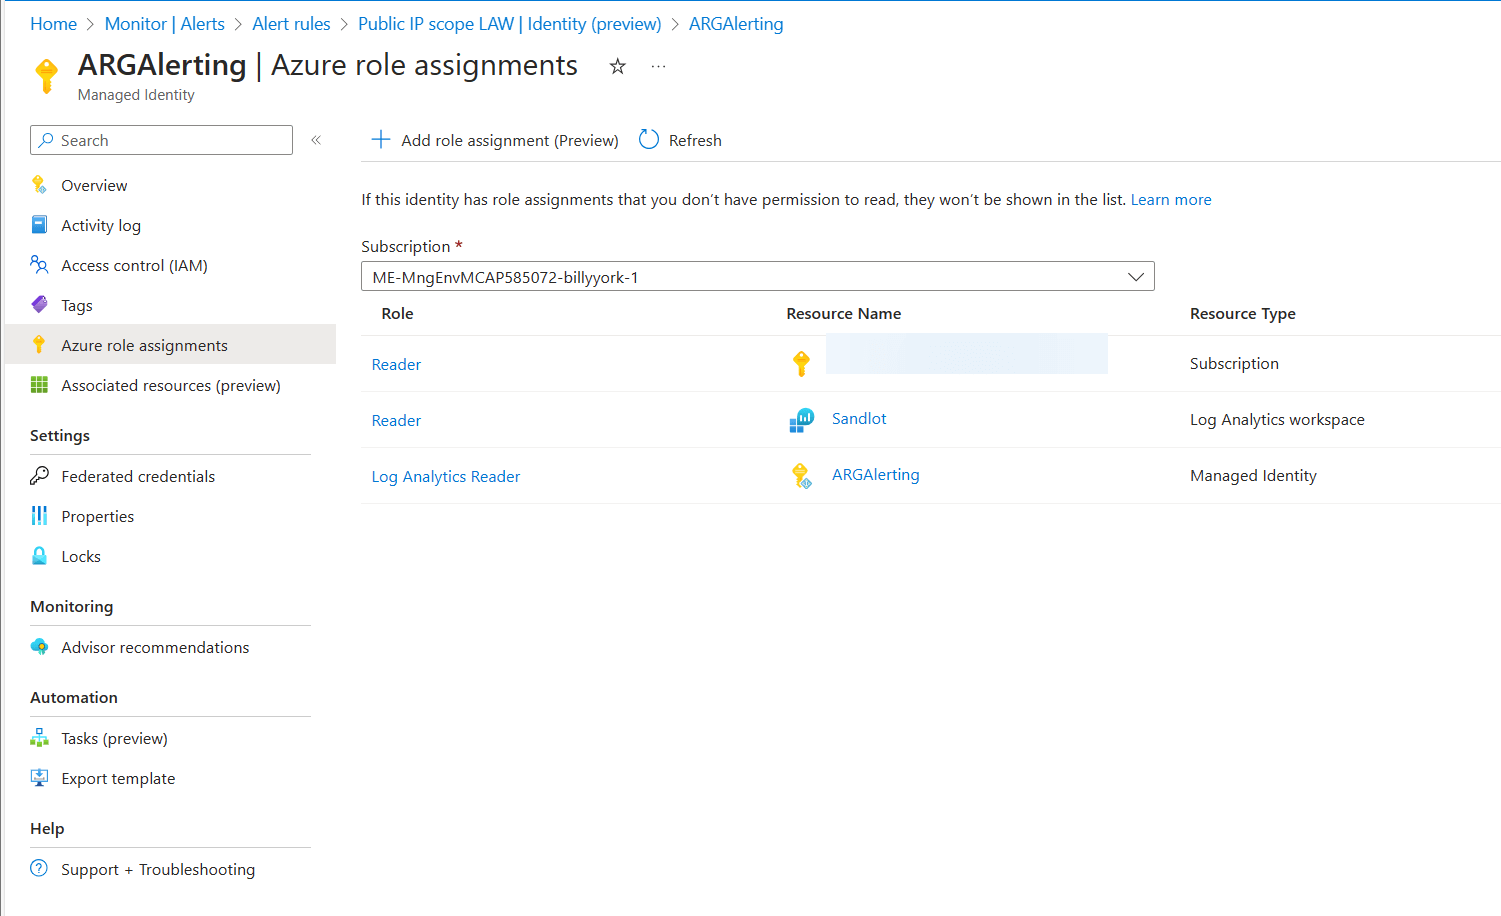
Select Azure role assignments. Then add reader to any resource(s) you want to alert on and log analytics reader roles to the identity. If you do not do this step your alert will never work. Because it doesn’t have the necessary permissions to query log analytics and or the resources you want to alert on.
Alert Creation
Everything else is the same as creating a Log Search Alert when creating an ARG Alert. Supply it with your time aggregation and evaluation frequency, action group and create the alert.
More Alerts
In my query post I gave some examples, I’ll provide some more here and all of them will be on my github.
VM Examples
Get high CPU Usage, filtered on tags.
let Threshold = 90;
arg("").Resources
| where type =~ 'microsoft.compute/virtualmachines' or type =~ 'microsoft.hybridcompute/machines'
| where isnotempty(tags)
| where tags !has "hidden-"
| mv-expand bagexpansion=array tags limit 400
| extend tagName = tags[0], tagValue = tags[1]
| where tagName == "Environment" and tagValue == "SandlotLab"
| project ResourceId = tolower(id), name, tagName, tagValue
| join(
          Perf
                 | where CounterName == "% Processor Time"
                 | summarize ['% Processor']=avg(CounterValue) by ResourceId = tolower(_ResourceId)
                 | where ['% Processor'] > Threshold)
          on ResourceId
| project ['% Processor'],ResourceId, name, tagName, tagValue
Get low disk space filtered on tags.
let Threshold = 10;
arg("").Resources
| where type =~ 'microsoft.compute/virtualmachines' or type =~ 'microsoft.hybridcompute/machines'
| where isnotempty(tags)
| where tags !has "hidden-"
| mv-expand bagexpansion=array tags limit 400
| extend tagName = tags[0], tagValue = tags[1]
| where tagName == "Environment" and tagValue == "SandlotLab"
| project ResourceId = tolower(id), name, tagName, tagValue
| join(
          Perf
                | where CounterName == "% Free Space"
                | summarize ['% Free Space']=avg(CounterValue) by ResourceId = tolower(_ResourceId)
                | where ['% Free Space'] < Threshold)
           on ResourceId
| project ['% Free Space'],ResourceId, name, tagName, tagValue
Get Memory Usage in InsightsMetrics because people like doing math in KQL. (Hint you can get % memory usage in Perf Table, if you don't want to do VM Insights)
let NameKey = "Environment";
let NameValue = "Sandlot";
arg("").Resources
| where type =~ 'microsoft.compute/virtualmachines' or type =~ 'microsoft.hybridcompute/machines'
| where isnotempty(tags)
| where tags !has "hidden-"
| mv-expand bagexpansion=array tags limit 400
| extend tagName = tags[0], tagValue = tags[1]
| where tagName == NameKey and tagValue == NameValue
| join(
           InsightsMetrics
                       | where Namespace == "Memory"
                       | extend Tags = todynamic(Tags)
                       | extend TotalMem = toreal(Tags['vm.azm.ms/memorySizeMB'])
                       | summarize RemainMB = avg(TotalMem - Val),
                                               ['Percent Used'] = avg(Val / TotalMem) by _ResourceId
                       | where RemainMB < 500 or ['% Used'] > 90)
           on ResourceId
| project ResourceId, RemainMB, ['% Used']
Resource Changes
Alert on any resource deletion
arg("").resourcechanges
| extend Target = tostring(properties.targetResourceType),
                changeType = tostring(properties.changeType),
                targetResourceId = tostring(properties.targetResourceId),
                timestamp = todatetime(properties.changeAttributes.timestamp),
                correlationId = todatetime(properties.changeAttributes.correlationId)
| where changeType == "Delete"
Alert on vNet Peering disconnection
</pre>

arg("").resourcechanges
| extend Target = tostring(properties.targetResourceType),
                changeType = tostring(properties.changeType),
                targetResourceId = tostring(properties.targetResourceId),
                timestamp = todatetime(properties.changeAttributes.timestamp),
                correlationId = todatetime(properties.changeAttributes.correlationId)
| where changeType == "Delete"
These are some good examples. Lots more to come, try it out, send feedback in. Don't forget to set your Managed Identity, lest you wonder why your alert doesn't work.