
Have you ever wanted to filter resources in Log Analytics by resource tags? Or wanted to query Azure Resource Graph data with a broader set of KQL? Well, do I have some news for you. Now we can query Azure Resource Graph directly from Log Analytics. I was fortunate enough to be a small part in testing this over the summer. Accidentally announced earlier this month, after being pushed back, today its officially official in public preview.
What do you need to know?
- all resource graph tables should be available
- case sensitivity for tables shouldn’t matter
- a broader set of KQL is available
- but not everything
- its still public preview, so you may find issues
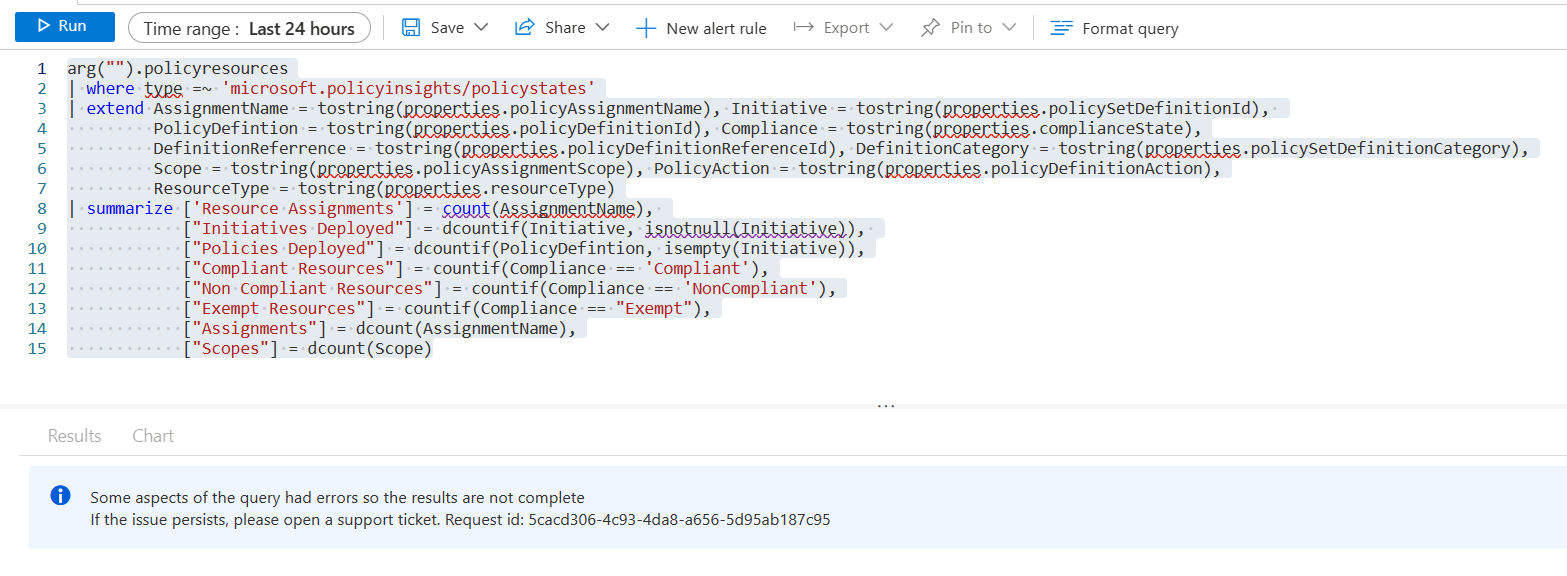
For instance the “ifs” with summarize, countif, sumif etc do not work, at this time. I’ve been working a lot with policy data recently, and some of the useful queries would be to query compliance for subscriptions, resource groups or even resources. Then take that data and use it in an Azure Monitor alert. Yes, that is the true reason for the integration, using ARG data for alerts. Like this example below grabbing compliance percentages with countif, currently does not work. They are aware of the issue and working through it.
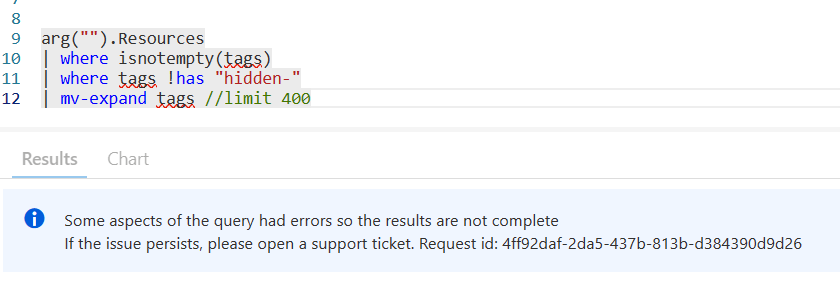
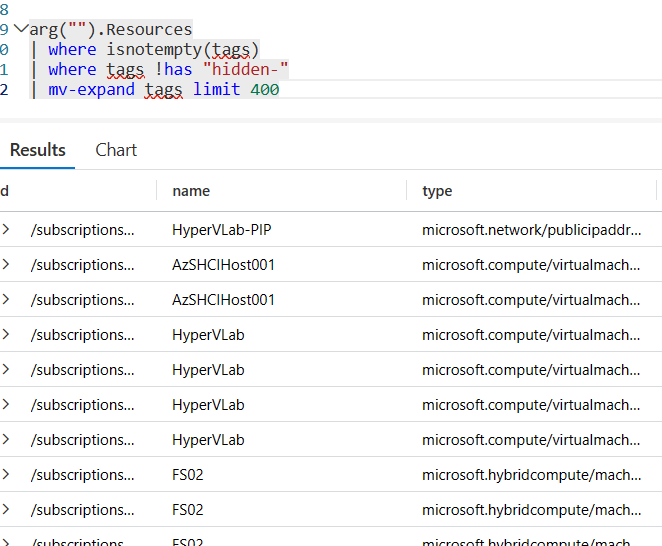
I have also seen queries fail to run stating “no known column, table, variable, or function” like seen here with the red underline under “type.” Except, this happens when you run the query. If you simply run the query again, it should work.
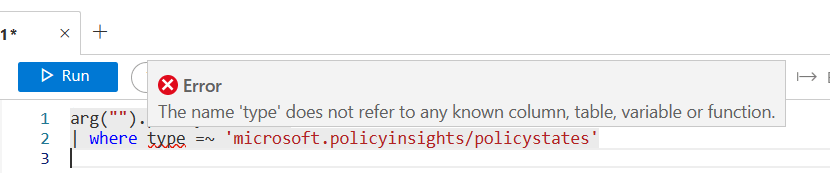
If it fails 2 or more times without returning data, it likely means that you are using an unsupported operator or function. I’ll show you the ones I’m aware of below.
But now have new things we can do with ARG data. For instance we can now use evaluate and its operators, like bag_unpack, pivot, narrow etc.
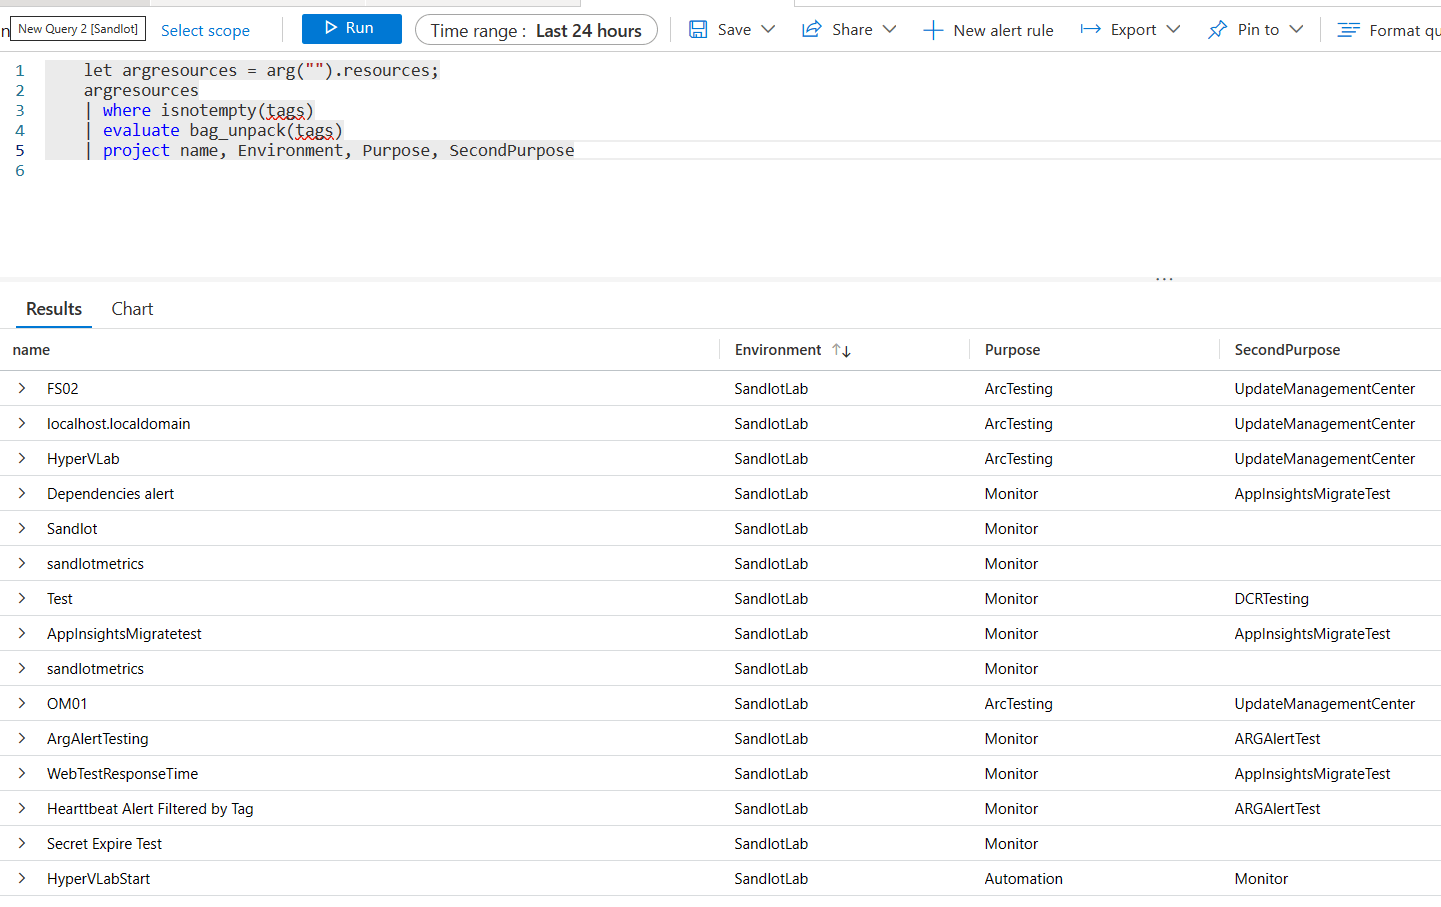
Oh by the way, we can also do let statements now, which ARG has famously not supported.
So evaluate works, but mv-apply doesn’t.
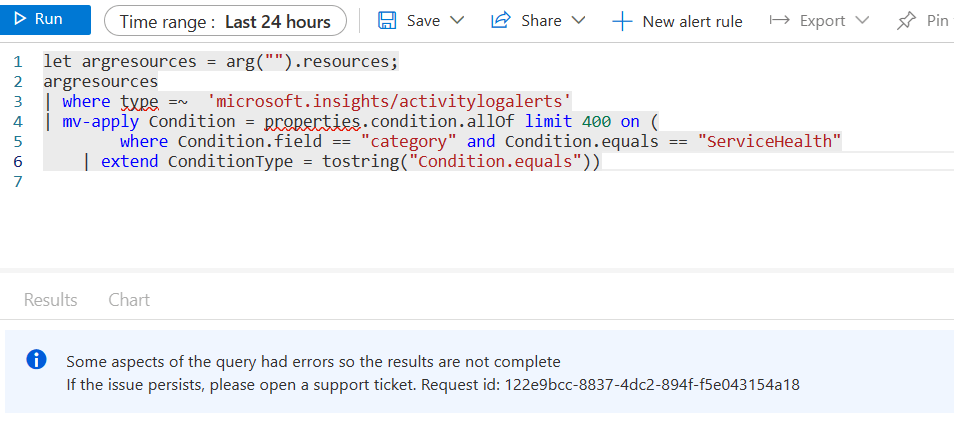
I asked for and received an explanation, but it still does not make sense to me that things like evaluate would work, when its not supported in ARG and mv-apply doesnt, when its also not supported natively in ARG, but both are in Log Analytics. Further, if we do a let statement with our ARG data, and join it with data in Log Analytics, mv-apply will still not work in the subsequent data.
Finally, whenever you use mv-expand, you need to specifically declare a limit, otherwise your query will fail.
This also does not make sense to me as I have never needed to use “limit” with mv-expand in either Log Analytics, or ARG. I’m consistently in one of the biggest consumers of Azure & Log Analytics, working with their huge amounts of data almost daily and never needed to put a limit after mv-expand with their data.
arg(“”)
Hopefully you noticed from the screen shots above, to query Azure Resource Graph data from Log Analytics, we need to use a pattern arg(“”) with the table name. Calling arg(“”) tells the Kusto engine to query the underlying Azure Data Explorer cluster for Azure Resource Graph. You still need the same rights as you would in ARG, IE read access to anything you want to query.
Alerts
I’ll have more examples on my repo in the next few days.(Full Examples here AzureResourceGraph-Examples/Alerts/ResourceGraphAlerting/Alerting.MD at master · scautomation/AzureResourceGraph-Examples · GitHub) There is also more to setting up an alert, which I will have a subsequent post on. But for now here’s some I have personally verified working with Alerts in Azure Monitor.
This first one was the most obvious one ever. It simply grabs any Azure or Arc machines and allows you to filter on tags.
let Threshold = 10m;
arg("").Resources
| where type =~ 'microsoft.compute/virtualmachines' or type =~ 'microsoft.hybridcompute/machines'
| where isnotempty(tags)
| where tags !has "hidden-"
| mv-expand bagexpansion=array tags limit 400
| extend tagName = tags[0], tagValue = tags[1]
| where tagName == "Environment" and tagValue == "SandlotLab"
| project ResourceId = id, tagName, tagValue
| join (
         Heartbeat
             | summarize LastHeartBeat = max(TimeGenerated),
                   arg_max(SubscriptionId, ResourceGroup, Computer)
              by ResourceId)
         on ResourceId
| where LastHeartBeat < ago(Threshold)
You could use the same concept for CPU/RAM/Disk alerts as well.
This next one works better as a report, maybe running 1 a day. But alert on Classic App Insights, which is out of support come February 2024.
arg("").Resources
| where type =~ 'microsoft.insights/components'
| extend WorkspaceType = properties.IngestionMode
| where WorkspaceType =~ "ApplicationInsights"
| project id, subscriptionId, resourceGroup, WorkspaceType
These next two are from the new Azure Update Manager which uses Azure Resource Graph to store its data, instead of Log Analytics like Azure Automation Update Management did.
This one will alert if an update run fails or times out.
arg("").maintenanceresources
| extend failed = toint(properties.resourceUpdateSummary.failed),
                timeout = toint(properties.resourceUpdateSummary.timedout),
                maintenanceId = tostring(properties.maintenanceConfigurationId),
                EndTime = todatetime(properties.endDateTime)
| where failed > 0 or timeout > 0
| where EndTime > ago(12h)
| summarize Failed=count() by maintenanceId
And this one will alert for machines pending updates.
arg("").patchassessmentresources
| where type has "softwarepatches"
| extend id = tolower(id)
| parse id with resourceId "/patchassessmentresults" *
| where isnotnull(properties.kbId)
| extend MissingUpdate = tostring(properties.patchName),
                Classification = tostring(properties.classifications[0])
| extend UpdatesNeeded = pack_array(MissingUpdate, Classification)
| summarize UpdatesNeeded = make_set(UpdatesNeeded), Count= count() by resourceId
Azure Monitor Alerts won’t pass the dynamic array object, however you can click on the alert to see what updates it needs. I need to see if I can modify it such that the set of updates needed is still a bag, but not dynamic array and the alert system includes it in the notification.
Once I’m able to actually test my Policy alerts I’ll add them to my github. Along with many others I’m working on.
Try it out, definitely send feedback back to the team. Having been briefly involved I can say this took effort from 3 different product groups working together for over a year to bring this all together. So its really cool to see it finally available.