Hello again, are you spending enough time in Azure Resource Graph (ARG) explorer? If not, you really should, there’s a treasure trove of data in there. The sad part is, either customers aren’t aware of it, or if they are the respective Product Groups aren’t doing a whole lot with the data. In particular with regards to reporting and dashboarding.
To that end I have created a Service Health workbook that I’ll be sharing with you. Yea yea TLDR github: scautomation/ServiceHealth: Workbook to visualize Service Health data (github.com)
Service Health Resources
The pattern that the ARG team has chosen is to do product name + “resources” on the end. So our service health table is called servicehealthresources. Within the service health table we have two types. Events and Impacted Resources. Events is ‘microsoft.resourcehealth/events’ and impacted resources is ‘microsoft.resourcehealth/events/impactedresources.’
As always with tables in ARG all the important data is under the “properties” table. So you’ll need to brush up on your extracting nested fields, if you’re not familiar with it.
This example query will get all impacted resources for a specific Alert Id and make them into a single set.
servicehealthresources
| where type =~ ‘microsoft.resourcehealth/events/impactedresources’
| parse id with alertId "/impactedResources/" *
| extend targetResourceId = tolower(properties.targetResourceId)
| summarize AffectedResources=make_set(targetResourceId) by alertId
| where isnotempty(AffectedResources)
I have added other example queries to my ARG repo here.
The Workbook
The workbook is actually fairly simple. No tabs, no hidden fields. Just a health set of parameters for filtering and then tiles, subscriptions and alert view.
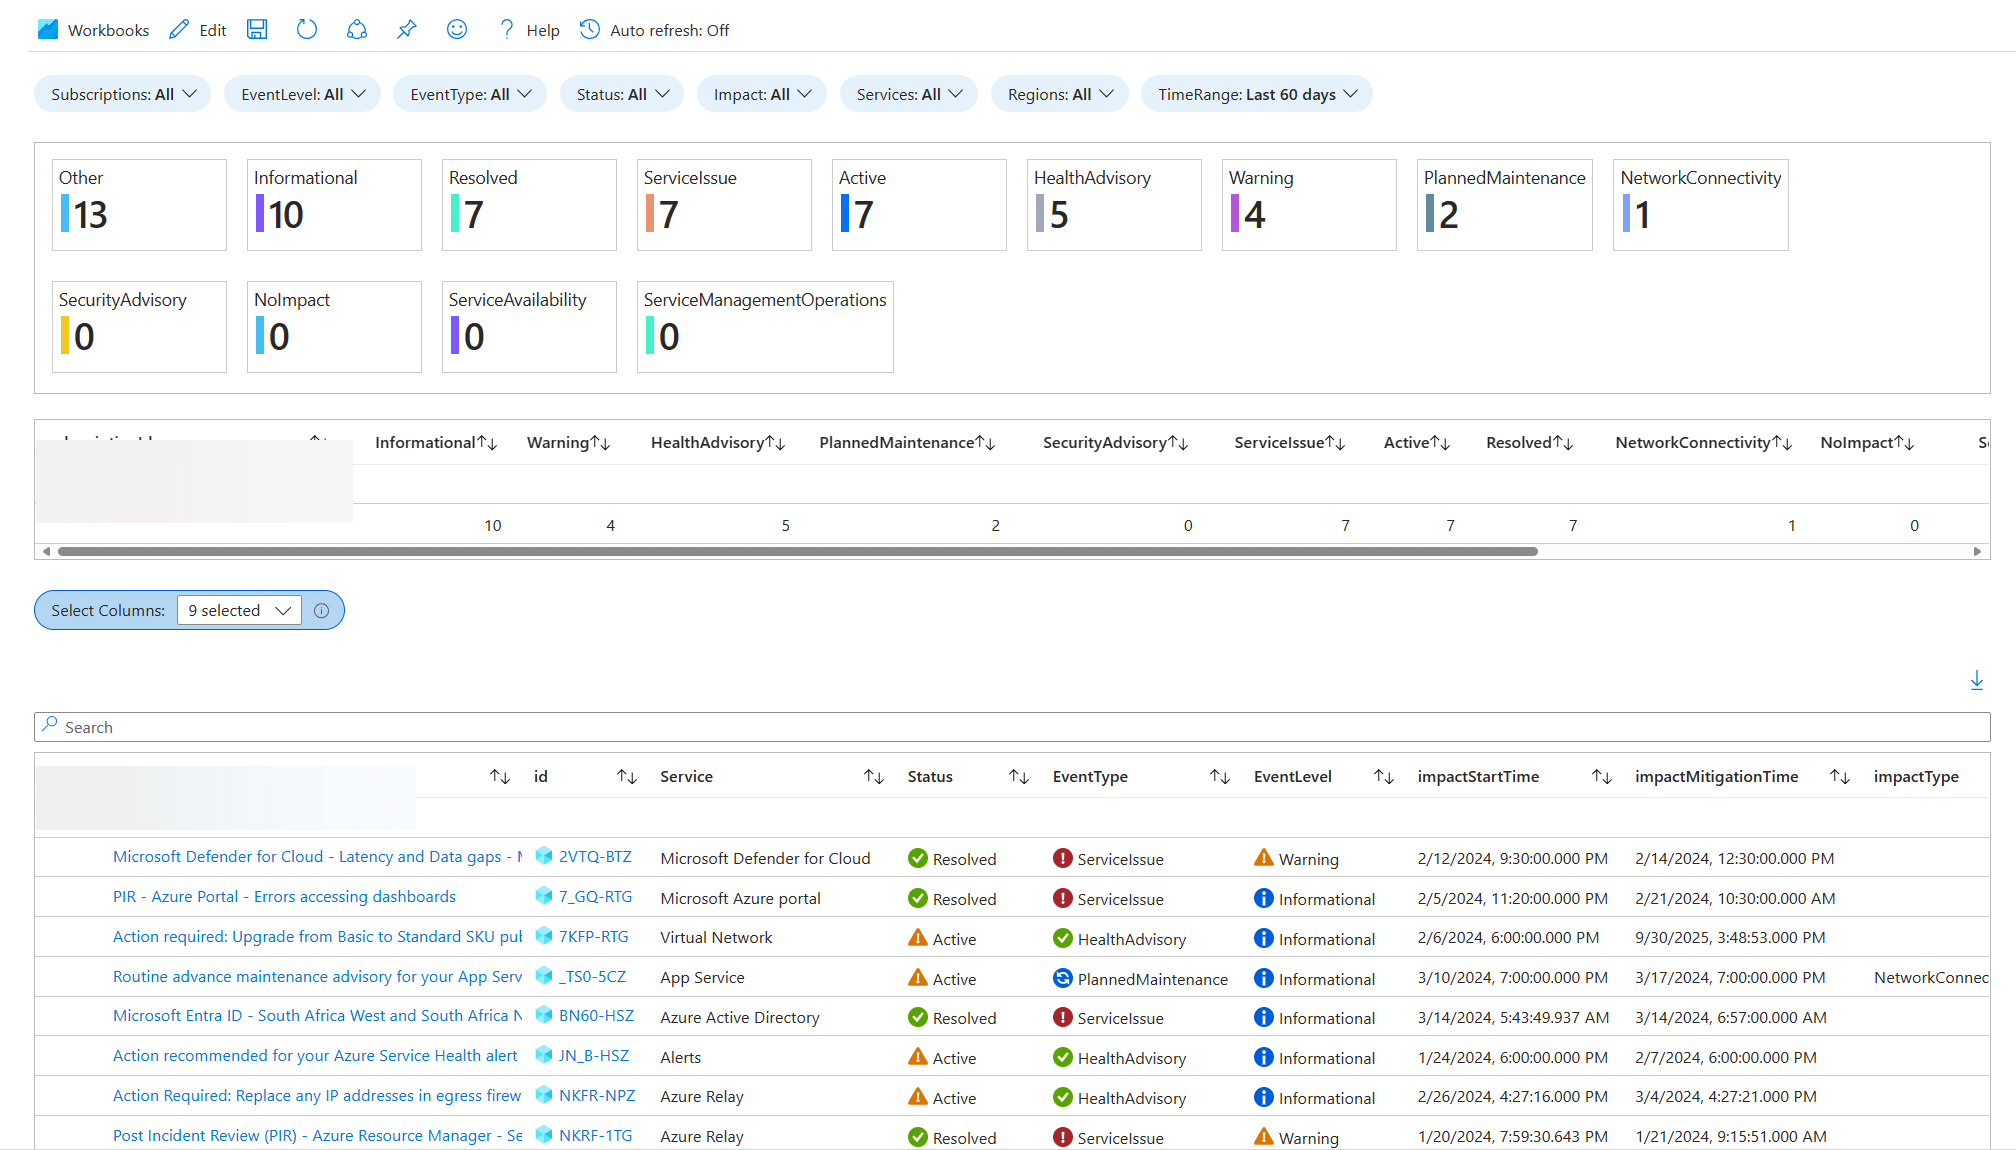
One cool thing I did add, was if you click on the title of the alert, it opens up the actual Azure portal blade, unfortunately, at this time I cannot get it to open wider. But hopefully sometime in the near future we’ll be able to change how wide that opens up.
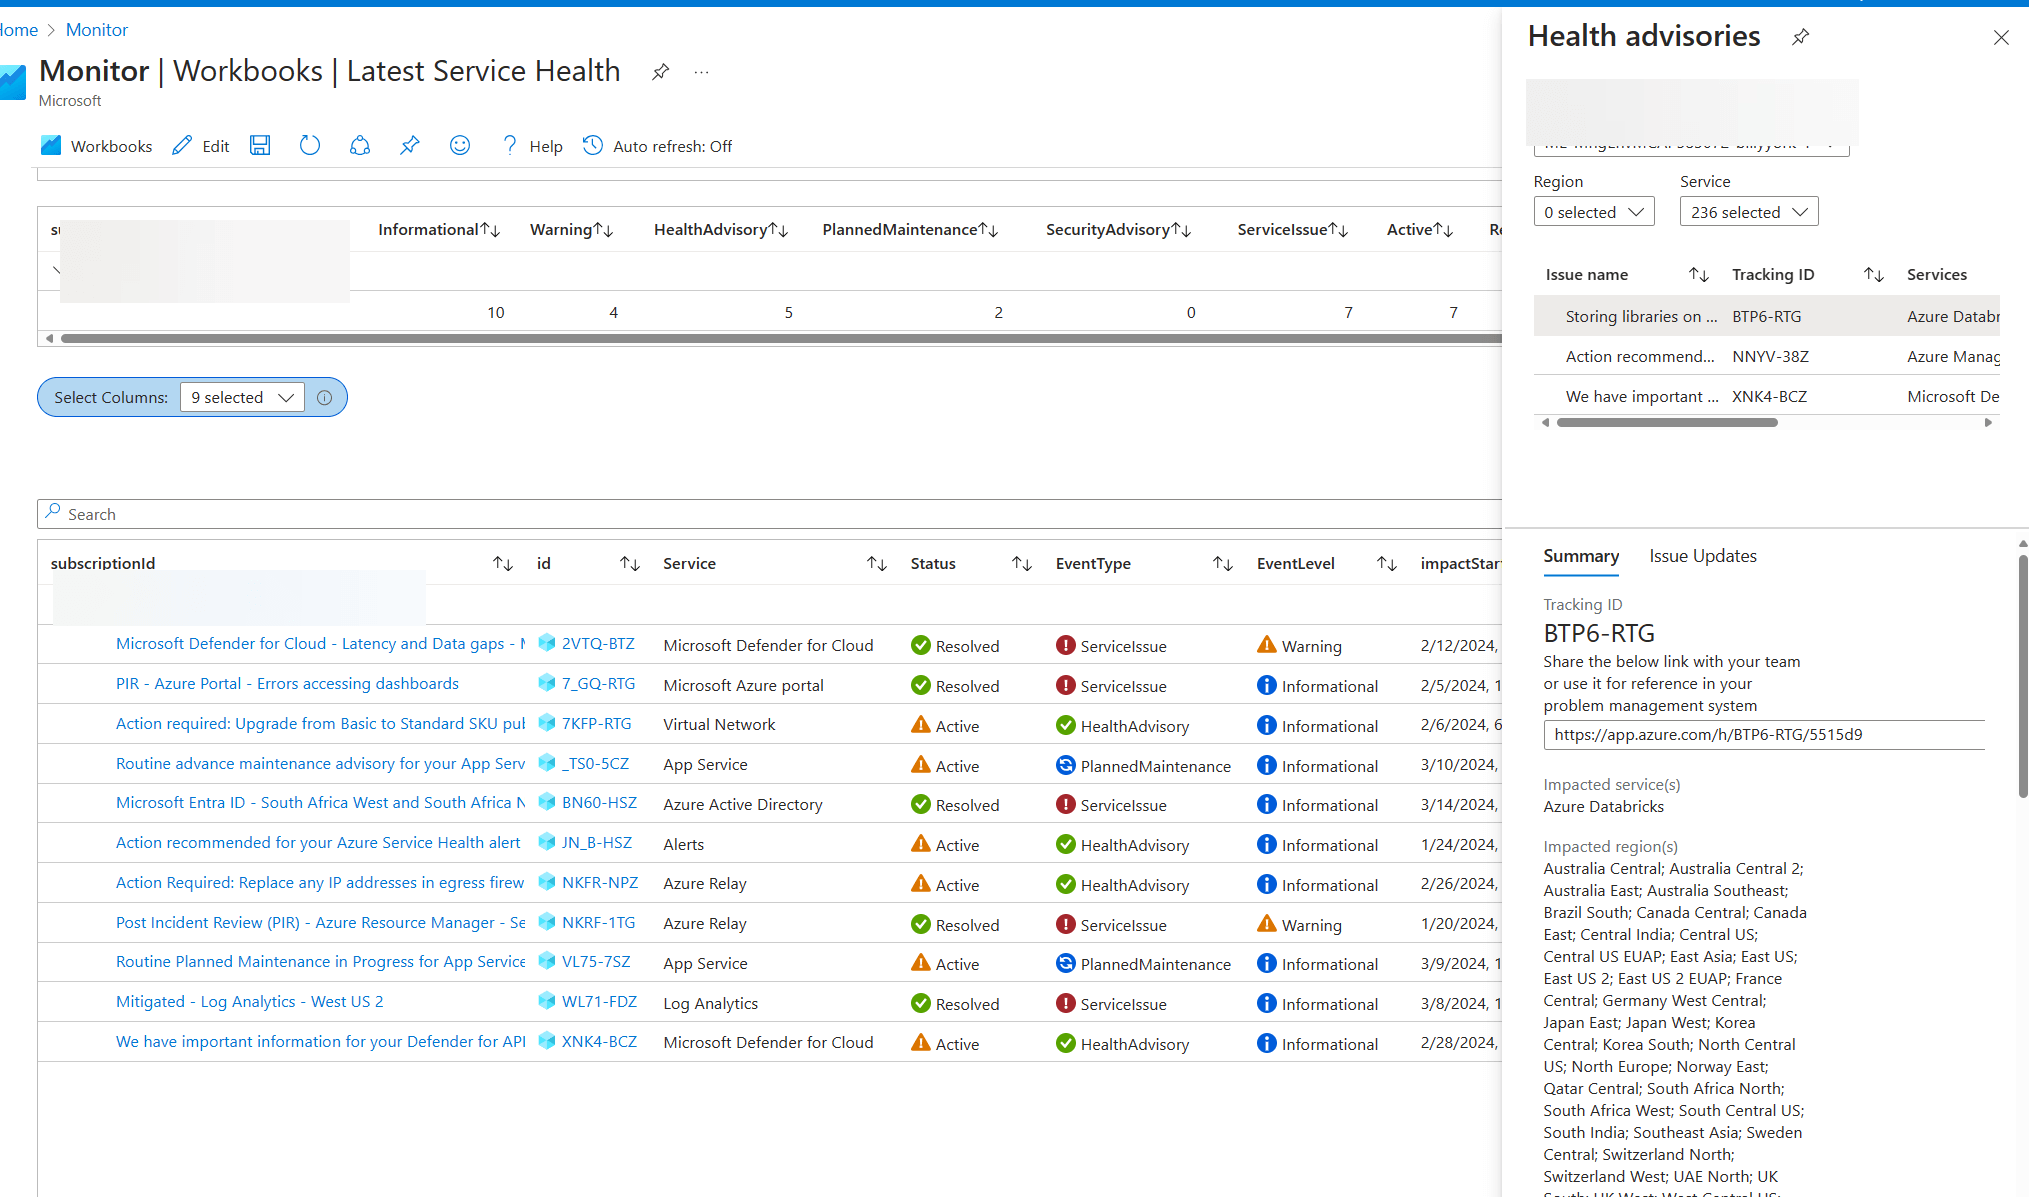
Thats really all there is to it.
Azure Resource Graph continues to grow and add more and more extremely useful and valuable data. The problem though is that it is a limited subset of KQL. I am often having to figure out hacky ways to do reporting of data that customers want. If by some snowballs chance in hell someone like Mark Russinovich or Scott Gutherie happens across this, please for the love all that’s holy can you convince whoever needs to be convinced to outlay money for giving Azure Resource Graph a broader set of KQL? Using it now is like taking your Ferrari to the track and racing it on 4 donuts. I tried to do a make-series in ARG the other day and was dumbfounded that it wasn’t supported. We’re hamstrung at every turn, but there’s a plethora of extremely useful and pertinent information in ARG. I understand that ARG isn’t a “money maker” but providing extra value to our customers with robust built in reporting options for their own data should not be dependent on how much money that product generates.