
For the longest time I recommended using % Committed Bytes in Use memory metric for Windows Servers in Azure Monitor and Log Analytics. Sometime last year it was brought to my attention by one of our fantastic senior support members, that the metric might not be the best for alerting.
% Committed Bytes In Use The ratio of Committed Bytes to the Commit Limit. Committed memory is the physical memory in use for which space has been reserved in the paging file should it need to be written to disk. The commit limit is determined by the size of the paging file. If the paging file is enlarged, commit limit is enlarged, the commit limit increases, and the ratio is reduced. This counter displays the current percentage value only; it is not an average.
Memory attributes – IBM Documentation
After reviewing it, my thoughts were well crap. For some reason there is no memory used percentage metric available like there is in Linux. Then a coworker came to me with a request from a customer for this exact scenario. We looked around, there are some queries out there but they were all really hacky.
We can tackle this two different ways.
Perf
If you are using Perf, or want to use Perf, you need the Available Bytes and Committed Bytes counters. Both of these are included in the default configuration of Data Collection Rules with the new Azure Monitor Agent.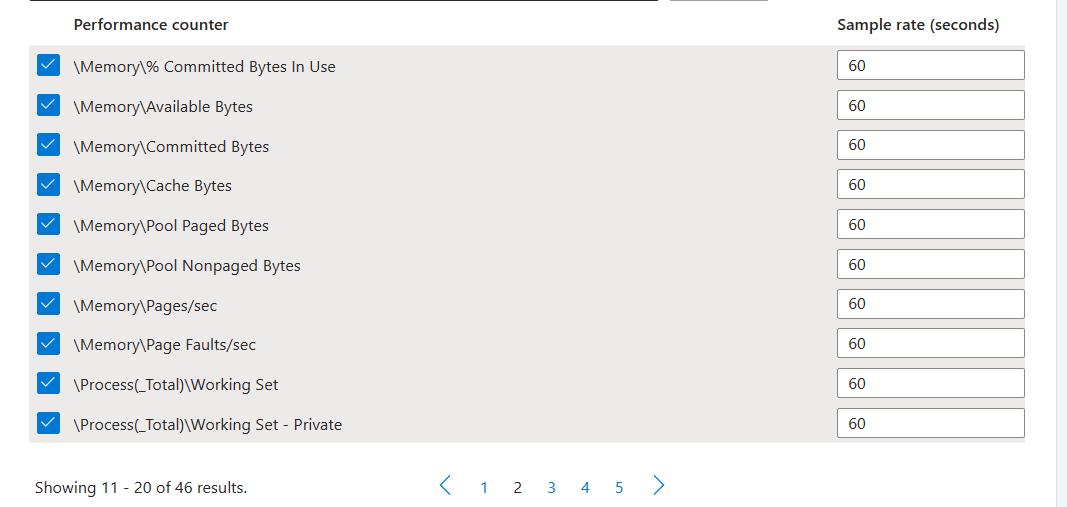
Perf
| where ObjectName == ‘Memory’ and
CounterName == ‘Committed Bytes’ or CounterName == ‘Available Bytes’
| summarize CommittedBytes = avgif(CounterValue, CounterName == ‘Committed Bytes’),
AvailableBytes = avgif(CounterValue, CounterName == ‘Available Bytes’) by _ResourceId, bin(TimeGenerated, 1h)
| extend Total = (CommittedBytes + AvailableBytes)
| extend AvgPercent = round(toreal(AvailableBytes / Total)* 100, 2)
This will get the average of both counters, then create a total amount, then get the average. We can then use this for alerting. But this this would have to be a log search alert. If you’ve read my blog before you know I prefer to use metrics against a Log Analytics workspaces as the resource.
VM Insights
If you’re using Azure Monitor for VMs. AKA VM Insights. AKA the InsightsMetrics table inside Log Analytics (yes I’m aware things like Container Insights also use this table), we can do the same thing.
InsightsMetrics
| where Namespace == "Memory"
| extend TotalMem = todynamic(Tags)
| extend TotalMem = todouble(todynamic(TotalMem.[‘vm.azm.ms/memorySizeMB’]))
| extend Used_MemPercent = Val / TotalMem
| extend Available_MemPercent = 100 – Used_MemPercent
This one will get you used and available memory percents, to which you can then create log alerts with.
And that’s it, two different ways to create used Memory Metric for Windows Servers in Log Analytics and alert with in Azure Monitor.