Did you know there’s all sorts of data in Azure Resource Graph, specifically all your active Azure Monitor alerts and your Alert inventory? If not why didnt you read my last post?
Anyway we have all this wonderful data, but not native built in reporting, in Azure Monitor like other monitoring tools like System Center Operations Manager (SCOM), New Relic, Dynatrace etc.
This workbook is built upon the queries shown in my last post and linked to above. It very much is still a work in progress, for instance show help and change log have not been added yet. But I wanted to share this out cause I think people can still find it useful.
TLDR github link scautomation/Azure-Monitor-Alert-Workbook: workbook built on Azure Resource Graph for Azure Monitor alerts (github.com)
How to import workbooks with list of my other available workbooks. How to Import Azure Monitor, Sentinel Workbooks Portal and PowerShell (cloudsma.com)
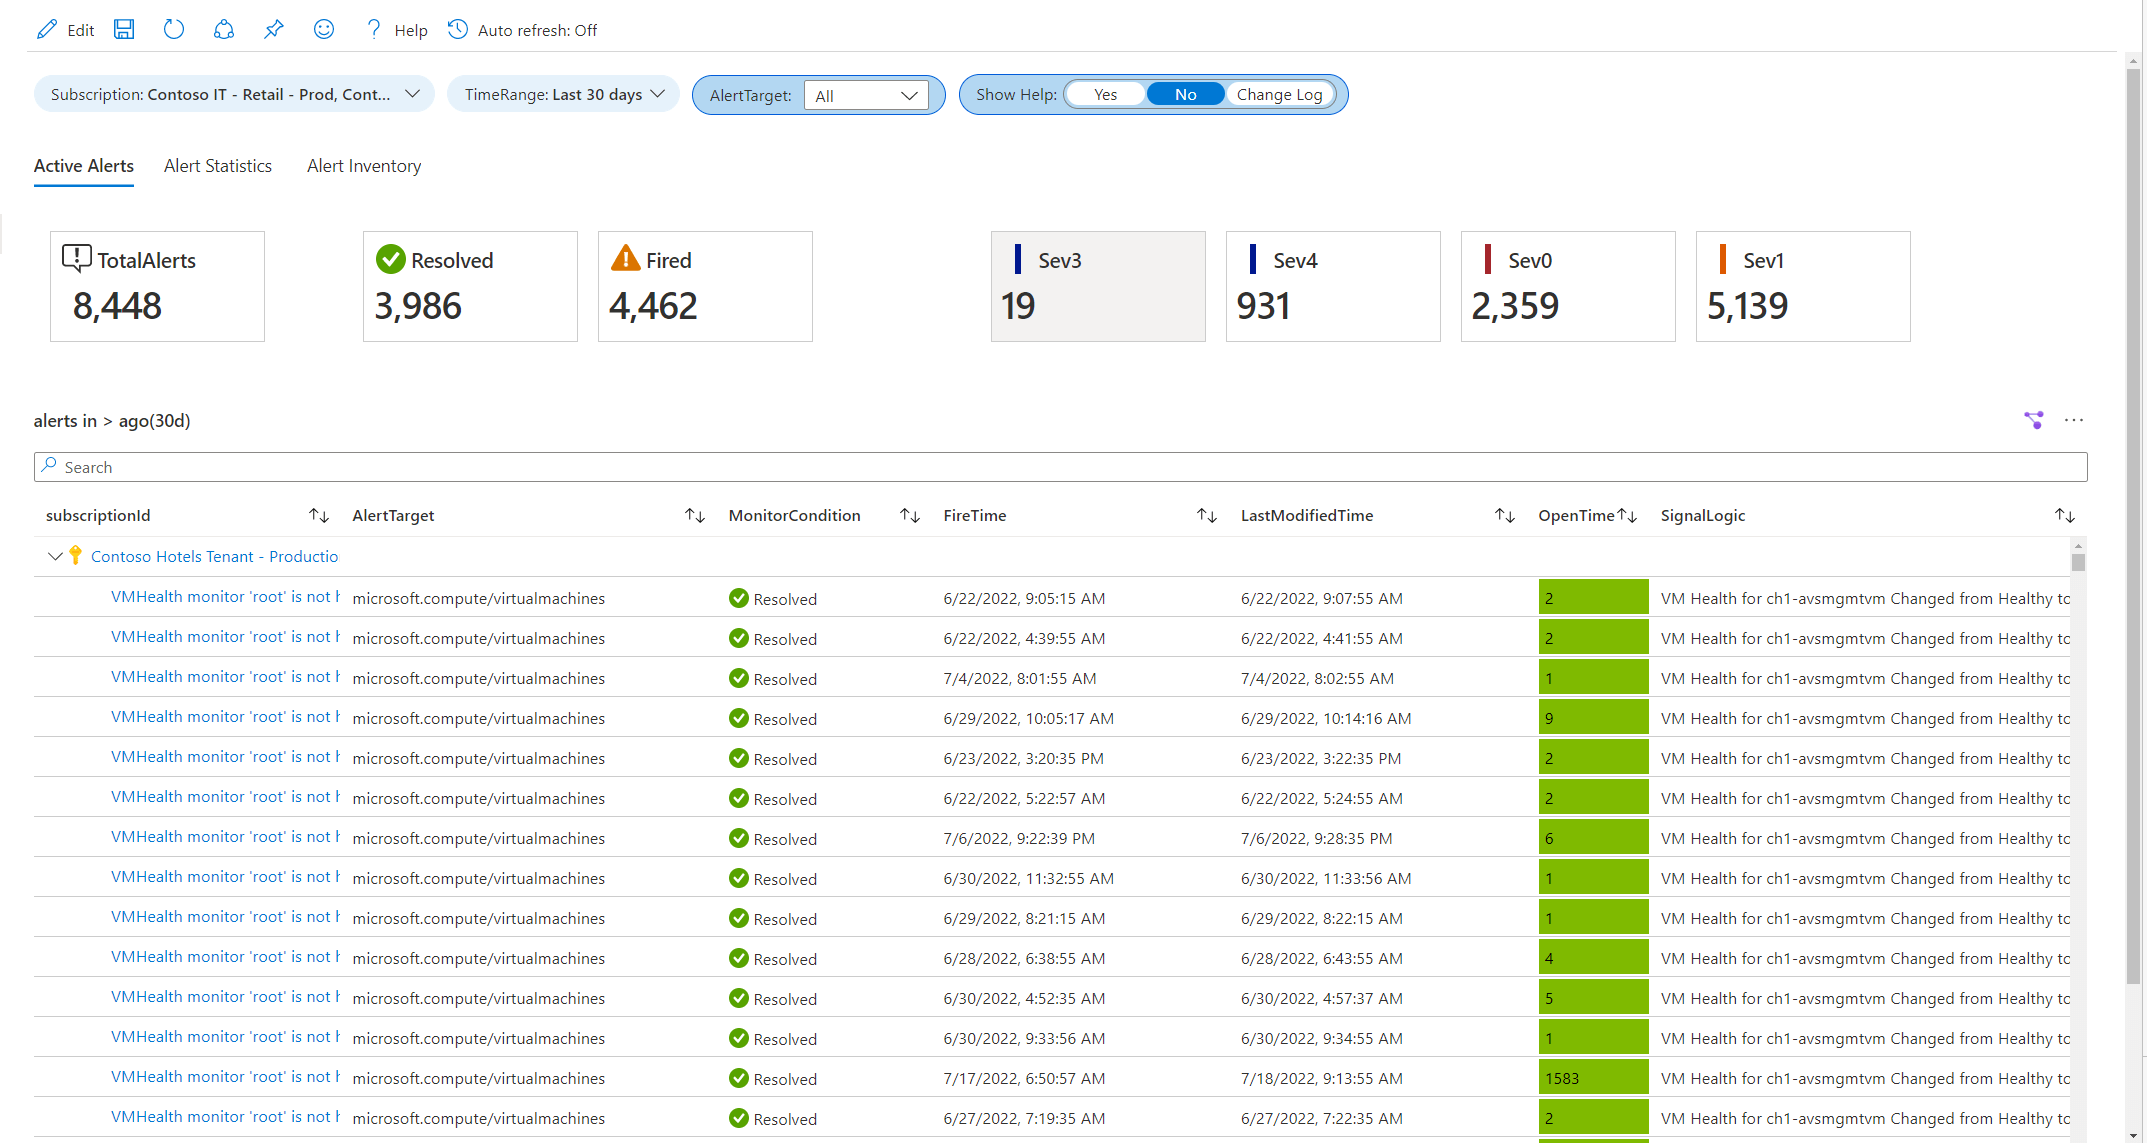
Active Alerts
In this view we have counts for Total Alerts, resolved, fired and then by Severity. In the details pane we have alerts sorted by Subscription, with its condition, fire time, last modified time, open time in minutes and SignalLogic. SignalLogic is another area that could probably use a little work.

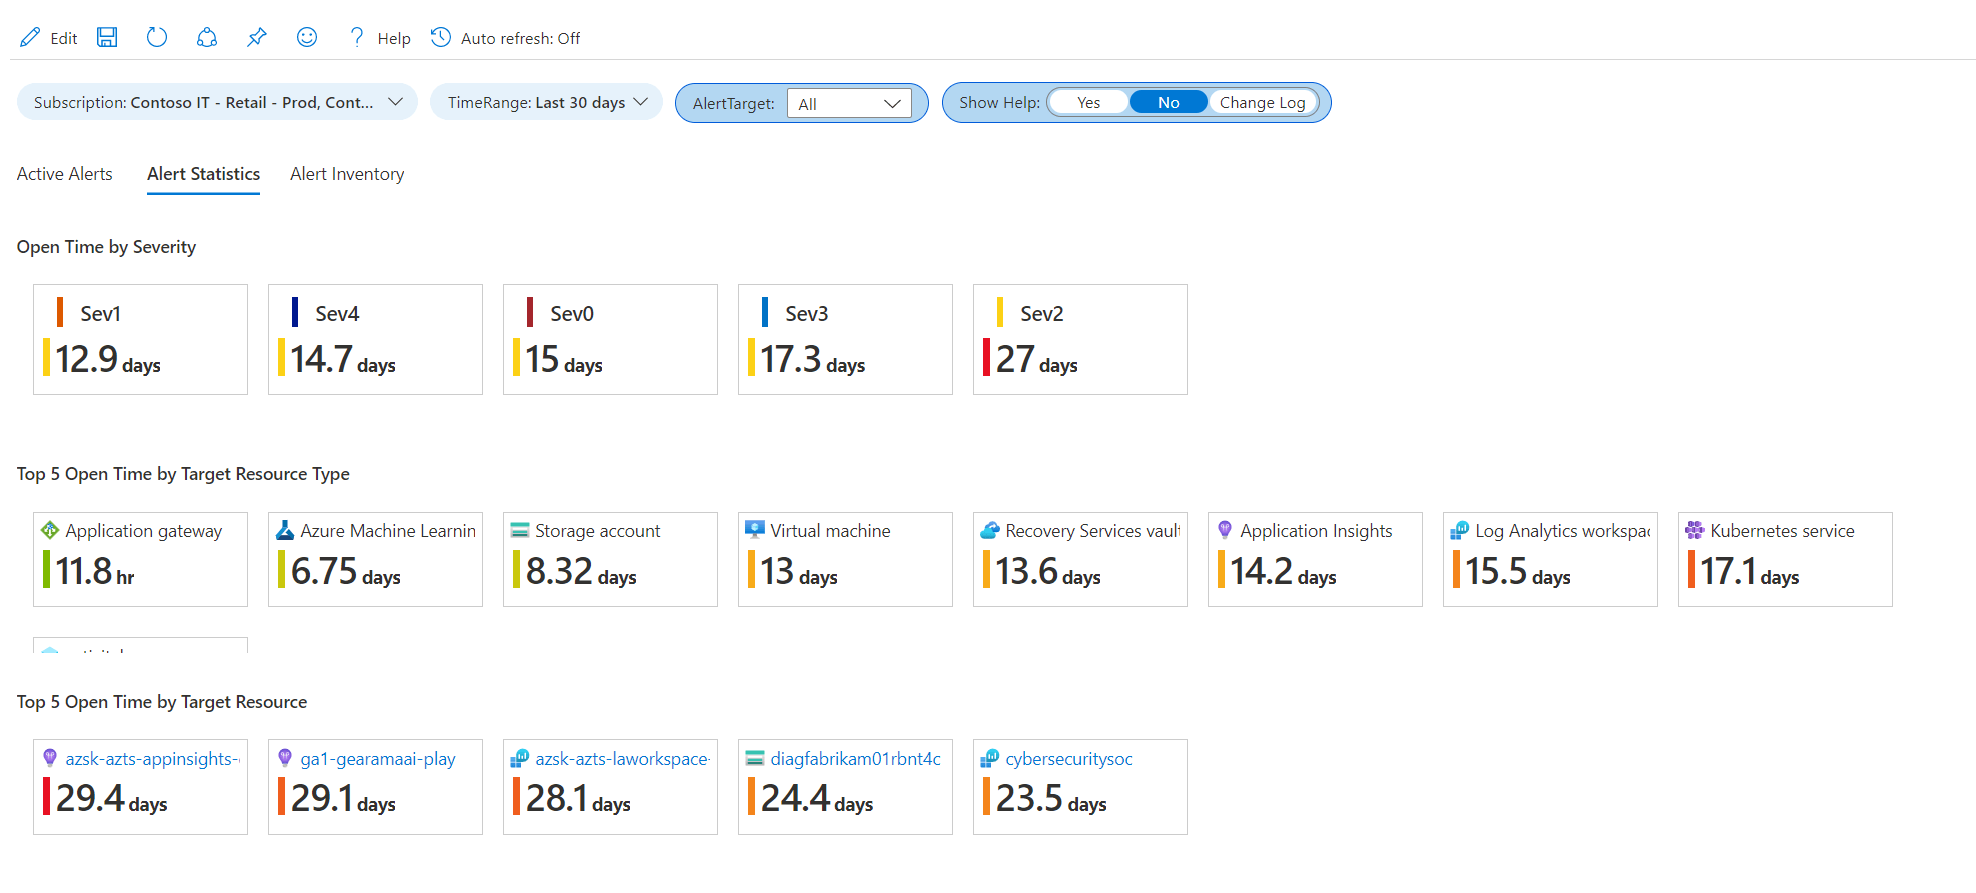
Alert Statistics
This was an idea I had when looking at the data available. Based on what’s in Azure Resource Graph, we can determine things like Average Open time in minutes by Severity, by resource type or target resources.

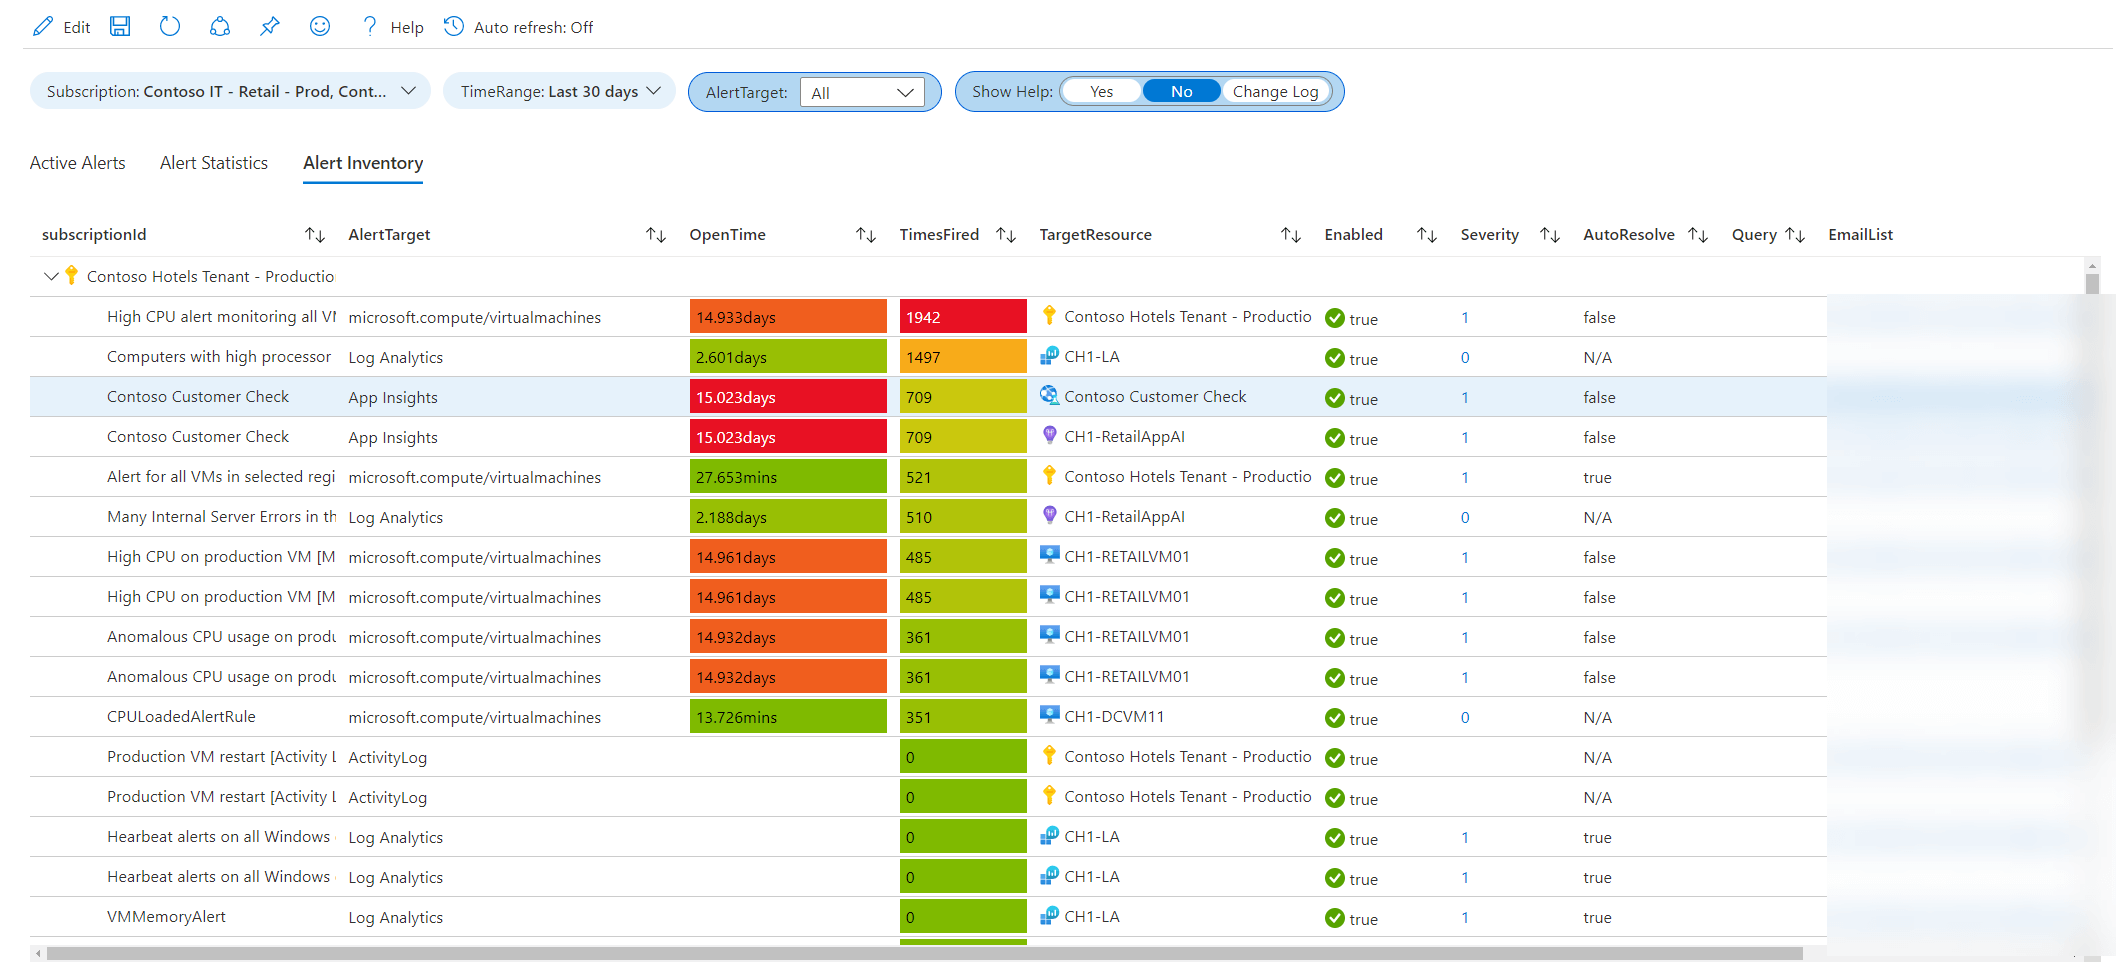
Alert Inventory
This view is using the resources table but also combing data with the active alerts to show if an alert has fired, how many times and its average open time.

Did you know you can print to PDF, workbooks?

Click on the ellipses at the top of any workbook and it will print that current page to PDF, or a real printer if you still use one of those. Now if we could only schedule sending reports via email we would have features from 10 years ago in SCOM.
Try it out let me know what you think, feel free to make modifications and do a pull request.
