In this post I’ll show you how to extract just about any Azure Monitor Alert information with Azure Resource Graph. With this data we can build some pretty neat Azure Monitor Alert reports. For Azure Monitor alerts we have two tables in Azure Resource Graph. Alertsmanagementresources and the resources table. Alerts management resources table has our active and resolved alerts. While the resources table has our inventory of alerts and action groups. Before we continue you’ll need to be familiar with Azure Resource Graph and extracting nested fields. I have several resources to help you if you are not familiar.
Posts:
- https://github.com/scautomation/AzureResourceGraph-Examples/blob/master/ZeroToHero.MD
- https://techcommunity.microsoft.com/t5/itops-talk-blog/azure-resource-graph-zero-to-hero/ba-p/2303572 (same as above with a few less examples, but 100% more screen shots)
- https://squaredup.com/webinars/azure-management-talk/azure-resource-graph-zero-to-hero/ (video presentation if you prefer video)
Tables and Types
In Azure Monitor there are several types of alerts. We have Activity Log, Log Search alerts, metric alerts, smart detection rules as resource types in the resource table. There is a dedicated table “alertsmanagementresources” for azure monitor alerts that have fired. The resources table has all Azure resources under it. So we can limit the resources table by resource type, but also report on alerts by type in the alerts management resources table.
Those types are:
- microsoft.insights/activitylogalerts
- microsoft.alertsmanagement/smartdetectoralertrules
- microsoft.insights/scheduledqueryrules
- microsoft.insights/alertrules
- microsoft.insights/metricalerts
and microsoft.insights/actiongroups for action groups.
So for example if we wanted to see all created alerts we can use the resources table and filter by those types
resources
| where type =~ 'microsoft.insights/activitylogalerts'
          or type =~ 'microsoft.alertsmanagement/smartdetectoralertrules'
          or type =~ 'microsoft.insights/scheduledqueryrules'
          or type =~ 'microsoft.insights/alertrules'
          or type =~ 'microsoft.insights/metricalerts'
Then if we wanted to see all alerts we would use the alertsmanagementresources table.
Alert Reporting
The Alerts management resources table is the table we want to use to build reports and get information on our active and resolved alerts. Like the resources table, most useful information is nested in the properties field. We’ll need to use the techniques shown in the posts above. For instance its useful to start queries under the alertsmanagementresources table with some fields right off the bat.
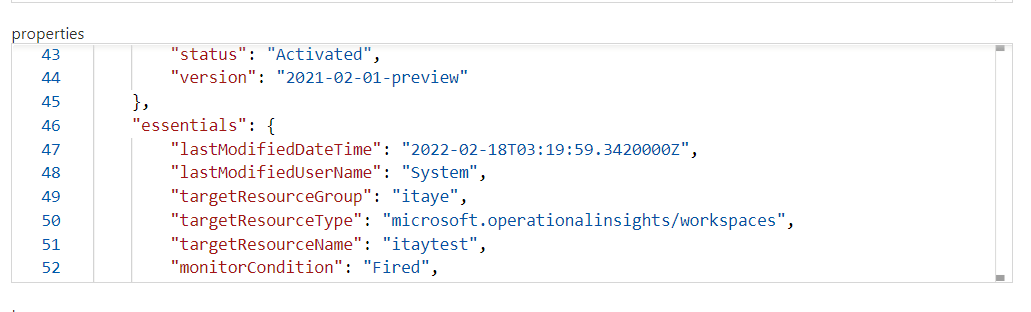
Fortunately for this table, they have added an “essentials” field under properties which has a lot of useful information. So this query creates three fields, FireTime, LastModifiedTime and MonitorCondtion. The first two are for when the alert first fired and when it was last modified. The last field, MonitorCondition, is for the current state of the alert, fired, resolved, closed etc.
alertsmanagementresources
| extend FireTime = todatetime(properties.essentials.startDateTime),
                LastModifiedTime = todatetime(properties.essentials.lastModifiedDateTime),
                MonitorCondition = tostring(properties.essentials.monitorCondition)
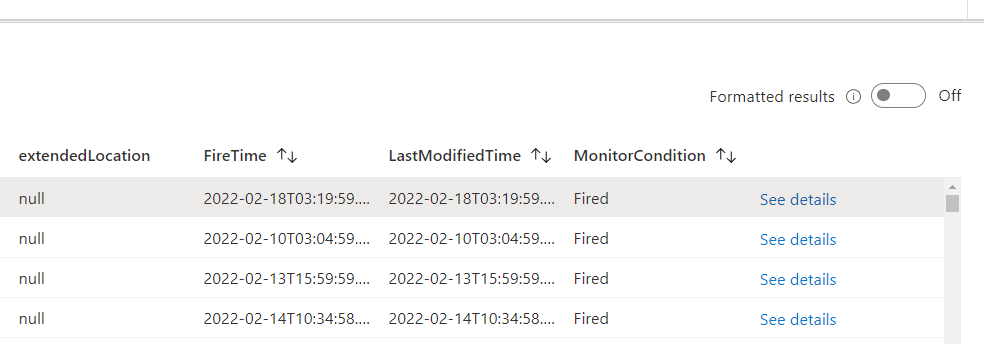
and the results
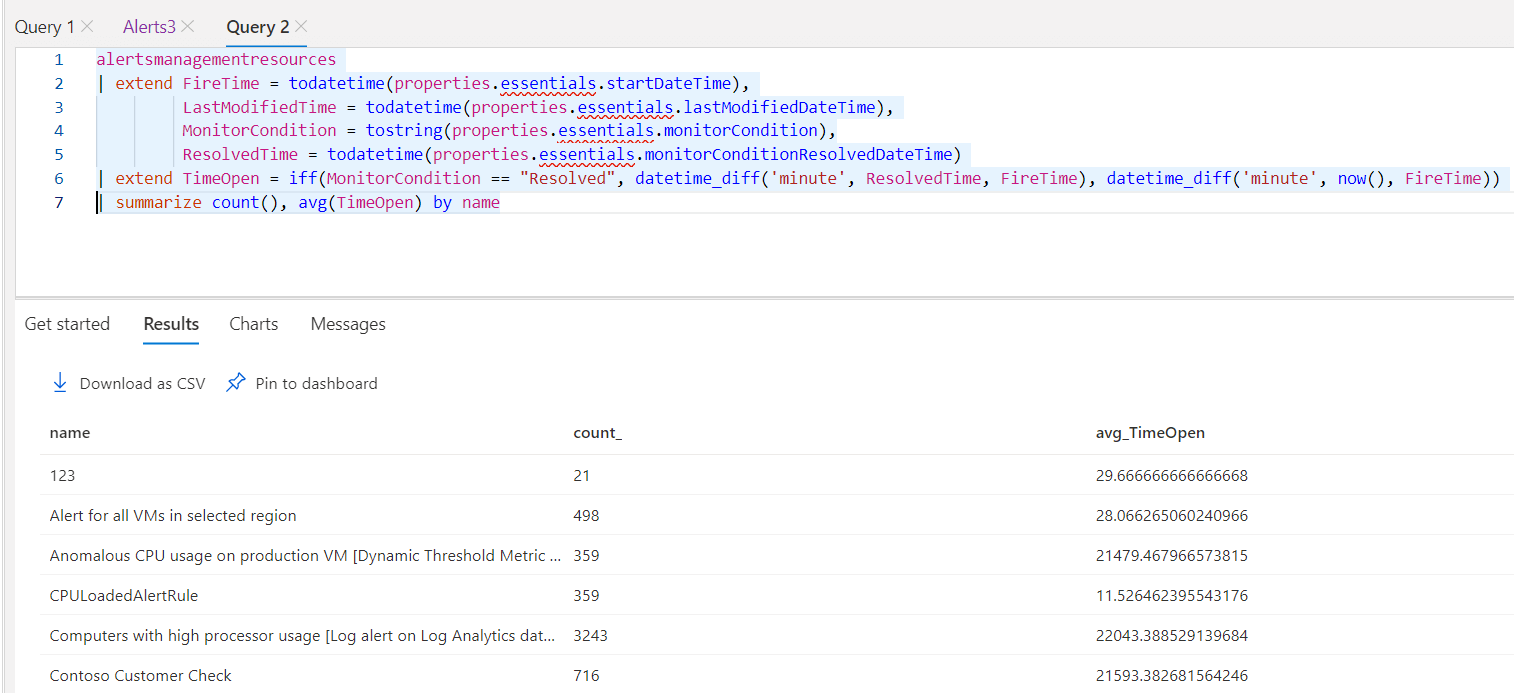
Now that we have this data we can do fun yet simple things like calculate how long tickets are open for, for instance.
alertsmanagementresources
| extend FireTime = todatetime(properties.essentials.startDateTime),
                LastModifiedTime = todatetime(properties.essentials.lastModifiedDateTime),
                MonitorCondition = tostring(properties.essentials.monitorCondition),
                ResolvedTime = todatetime(properties.essentials.monitorConditionResolvedDateTime)
| extend TimeOpen = iff(MonitorCondition == "Resolved", datetime_diff('minute', ResolvedTime, FireTime), datetime_diff('minute', now(), FireTime))
| summarize count(), avg(TimeOpen) by name
Using the fabulous datetime_diff, with an iff() statement that says if the alert is resolved calculate from the open time to the close time in minutes, but if its not resolved calculate from now() to the open time, in minutes. Then we can summarize count the alerts and avg open time by the alert name.
We can also summarize by subscriptionId if we wanted to count by subscription, or by subscription and name.
Note there is no timestamp or timegenerated field in Azure Resource Graph. So these queries by default are for the last 30 days. If you want to filter by time you can use the FireTime field and then compare to ago().
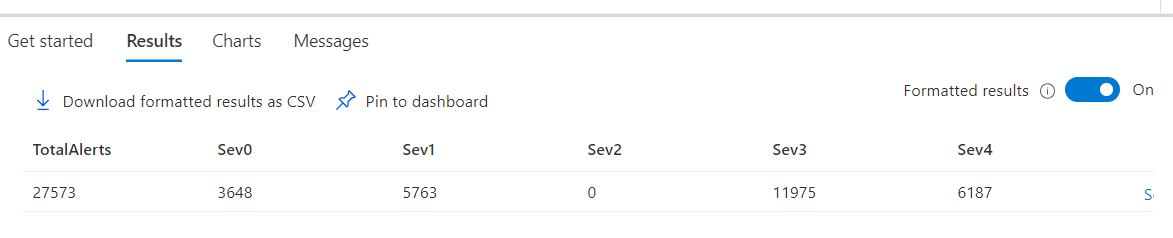
Severity is also included in the essentials field. With this query we can summarize the total alerts and the count by severity.
alertsmanagementresources
| extend FireTime = todatetime(properties.essentials.startDateTime),
                Severity = tostring(properties.essentials.severity),
                MonitorCondition = tostring(properties.essentials.monitorCondition),
                AlertTarget = tostring(properties.essentials.targetResourceType),
                MonitorService = tostring(properties.essentials.monitorService)
| summarize TotalAlerts= count(),
                       Sev0 = countif(Severity == 'Sev0'),
                       Sev1 = countif(Severity == 'Sev1'),
                       Sev2 = countif(Severity == 'Sev2'),
                       Sev3 = countif(Severity == 'Sev3'),
                       Sev4 = countif(Severity == 'Sev4')
Comprehensive Report
Applying all the concepts posted above and adding some case capabilities, similar to what I did in my Azure Inventory workbook we can grab the actual queries used in log search alerts, deduce the signal logic and put it all together.
alertsmanagementresources
| extend FireTime = todatetime(properties.essentials.startDateTime),
                LastModifiedTime = todatetime(properties.essentials.lastModifiedDateTime),
                Severity = tostring(properties.essentials.severity),
                MonitorCondition = tostring(properties.essentials.monitorCondition),
                AlertTarget = tostring(properties.essentials.targetResourceType),
                MonitorService = tostring(properties.essentials.monitorService),
                ResolvedTime = todatetime(properties.essentials.monitorConditionResolvedDateTime)
| extend AlertTarget = case(
                         MonitorService == 'ActivityLog Administrative', 'ActivityLog',
                         AlertTarget == 'microsoft.insights/components', 'App Insights',
                         AlertTarget == 'microsoft.operationalinsights/workspaces', 'Log Analytics',
                         AlertTarget)
| mv-expand Condition = properties.context.context.condition.allOf
| extend SignalLogic = case(
                        MonitorService == "VM Insights - Health", strcat("VM Health for ", properties.essentials.targetResourceName, "Changed from ", properties.context.monitorStateBeforeAlertCreated, " to ", properties.context.monitorStateWhenAlertCreated),
                        AlertTarget == "ActivityLog", strcat("When the Activity Log has Category = ", properties.context.context.activityLog.properties.eventCategory, " and Signal name = ", properties.context.context.activityLog.properties.message),
                        MonitorService == "Smart Detector", strcat(properties.SmartDetectorName, " Detected failure rate of ", properties.DetectedFailureRate, " above normal failure rate of ", properties.context.NormalFailureRate),
                        MonitorService == "Log Analytics", strcat("Alert when ", properties.context.AlertType, " is ", properties.context.AlertThresholdOperator, " threshold ", properties.context.AlertThresholdValue),
                        MonitorService == "ActivityLog Autoscale", strcat(properties.context.context.activityLog.operationName, " from ", properties.context.context.activityLog.properties.oldInstancesCount, " to ", properties.context.context.activityLog.properties.newInstancesCount),
                        strcat("Alert when metric ", Condition.metricName, Condition.timeAggregation, " is ", Condition.operator, " threshold ", Condition.threshold)),
              Query = case(
                       MonitorService == "Log Alerts V2", tostring(Condition.searchQuery),
                       MonitorService == "Log Analytics", tostring(properties.context.SearchQuery), "N/A"),
                       MetricValue = iff(MonitorService == "Log Analytics", toint(properties.context.ResultCount), toint(Condition.metricValue)),
             ResourceName = iff(AlertTarget == "ActivityLog", properties.context.context.activityLog.subscriptionId, tostring(properties.essentials.targetResourceName))
| extend OpenTime = iff(MonitorCondition == "Resolved", datetime_diff('minute', ResolvedTime, FireTime), datetime_diff('minute', now(), FireTime)),
                Details = pack_all()
| project name, AlertTarget, subscriptionId, MonitorCondition, FireTime, ResolvedTime, OpenTime, SignalLogic, Query, MetricValue, ResourceName, Details
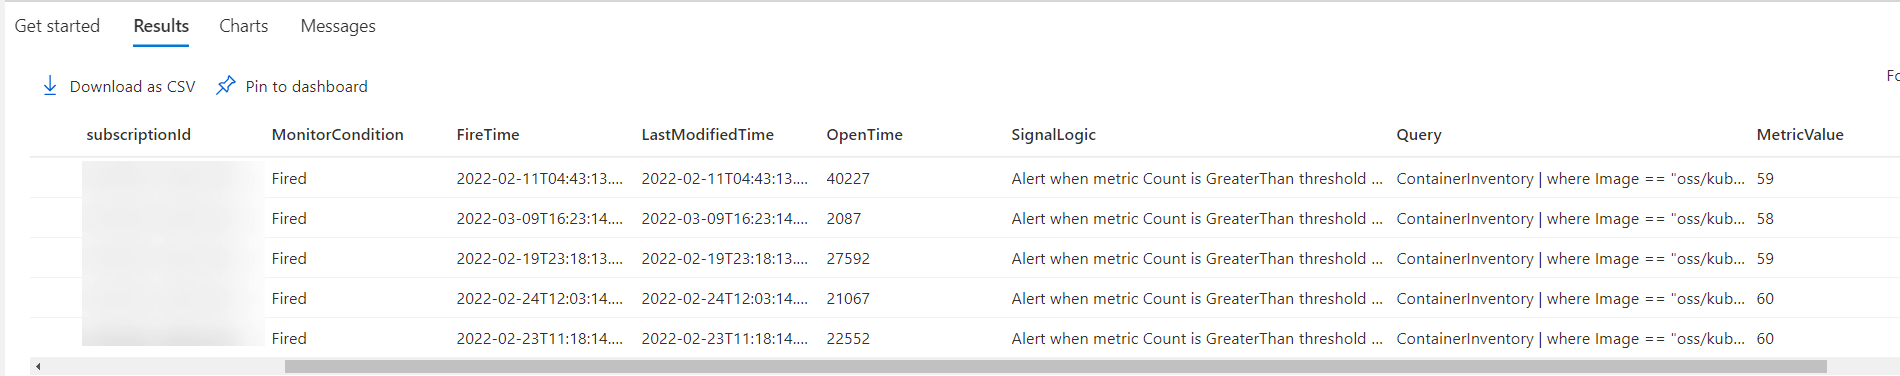
There is definitely a lot going on here. Each alert type is developed by different teams within different Product Groups there isn’t a complete single standard for alerts. The query is easier to understand when broken down by each case function that is used. The first one, Alert Target, is because the resource type in the alerts management field is not useful. So I have created a new field and determine with case what the actual resource target is, either log analytics, app insights, activity log or an alert against a specific resource type like virtual machines.
The second one for Signal Logic is because each alert type has different logic, in particular the VM Insights Health and Activity Log autoscale alerts are drastically different than say a log search alert in Log Analytics.
Alerts Inventory
Now lets take a look at some things we can do with the inventory of our Azure Monitor alerts in the resources table in Azure Resource Graph.
We can attach our alerts to their corresponding action groups. Or conversely, find alerts with no action group assigned.
resources
| where type =~ 'microsoft.insights/metricalerts'
          or type =~ 'microsoft.insights/activitylogalerts'
          or type =~ 'microsoft.insights/scheduledqueryrules'
          or type =~ 'microsoft.alertsmanagement/smartdetectoralertrules'
          or type =~ 'microsoft.insights/scheduledqueryrules'
          or type =~ 'microsoft.insights/webtests'
| extend ActionGroup = todynamic(case(
                type =~ 'microsoft.alertsmanagement/smartdetectoralertrules', properties.actionGroups.groupIds,
                type =~ 'microsoft.insights/metricalerts', properties.actions,
                type =~ 'microsoft.insights/scheduledqueryrules', properties.action.aznsAction.actionGroup,
                type =~ 'microsoft.insights/activitylogalerts', properties.actions.actionGroups, ''))
| mv-expand ActionGroup
| extend ActionGroup = case(isnull(ActionGroup), 'No Action Group Assigned',
                isnotnull(ActionGroup.actionGroupId), tolower(ActionGroup.actionGroupId),
                tolower(ActionGroup))
Once again I’m using case to normalize data from the alert data. In this instance, action group ID from the different alert types, because they are in different areas under properties. Because we can have more than one action group per alert you may end up with more records than just alerts. On the flip side of that I have added to the case statement that if action group ID is null that there is no action group assigned.
Taking this query a step further we can get the email address(es) assigned in the action group, or any other action defined in the action group.
resources
| where type =~ 'microsoft.insights/metricalerts'
          or type =~ 'microsoft.insights/activitylogalerts'
          or type =~ 'microsoft.insights/scheduledqueryrules'
          or type =~ 'microsoft.alertsmanagement/smartdetectoralertrules'
          or type =~ 'microsoft.insights/scheduledqueryrules'
          or type =~ 'microsoft.insights/webtests'
| extend ActionGroup = todynamic(case(
                type =~ 'microsoft.alertsmanagement/smartdetectoralertrules', properties.actionGroups.groupIds,
                type =~ 'microsoft.insights/metricalerts', properties.actions,
                type =~ 'microsoft.insights/scheduledqueryrules', properties.action.aznsAction.actionGroup,
                type =~ 'microsoft.insights/activitylogalerts', properties.actions.actionGroups, ''))
| mv-expand ActionGroup
| extend ActionGroup = case(isnull(ActionGroup), 'No Action Group Assigned',
                isnotnull(ActionGroup.actionGroupId), tolower(ActionGroup.actionGroupId),
                tolower(ActionGroup))
| join kind=leftouter (
          resources
                  | where type =~ 'microsoft.insights/actiongroups'
                  | extend Email = properties.emailReceivers
                  | mv-expand Email = Email
                  | summarize EmailList=make_list(Email.emailAddress) by ActionGroup=tolower(id))
          on ActionGroup
This query looks at all alerts that exist and does a left outer join with the action groups. We use left outer because it is also possible to have no action groups assigned to an alert. Inner Unique join would eliminate all records that don’t both have a alert and an action group.
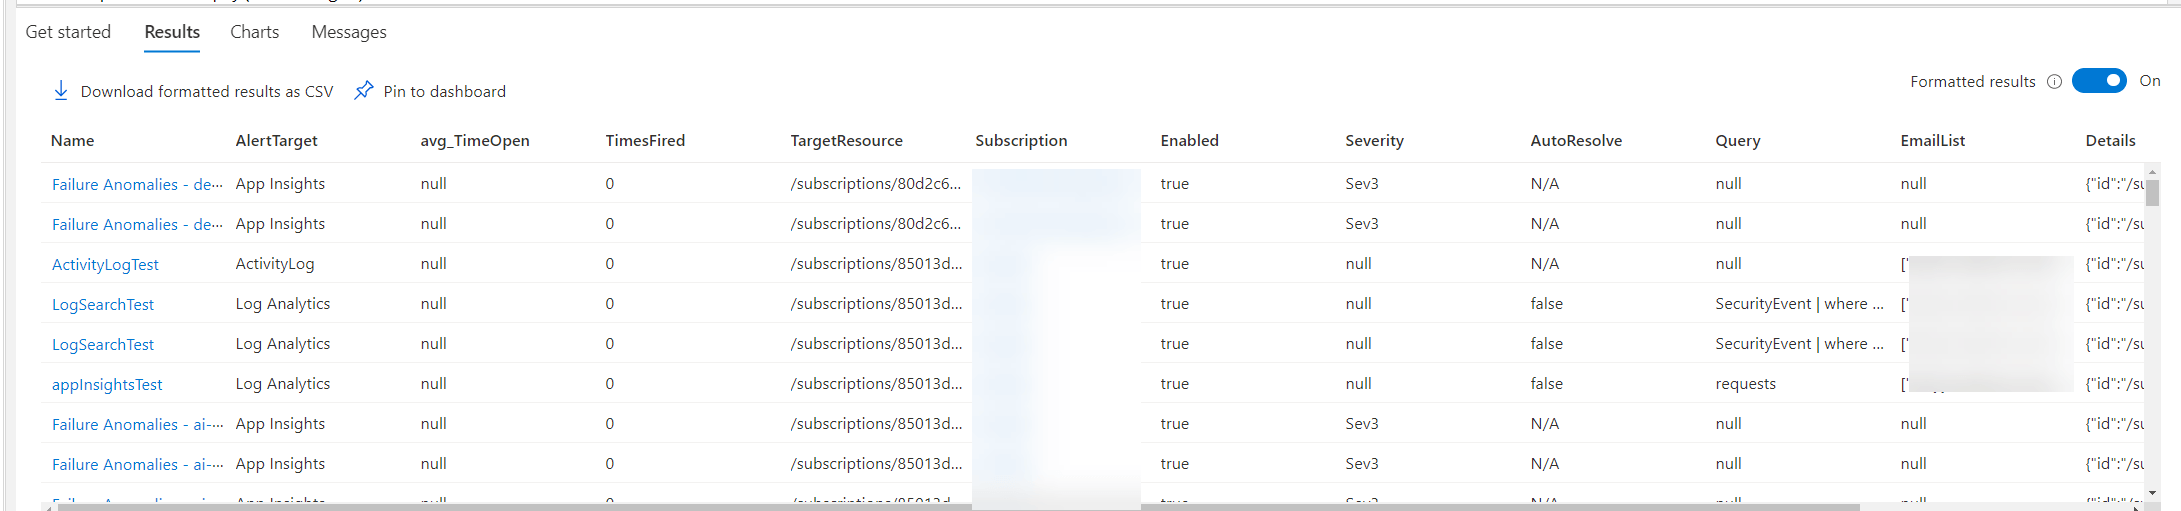
Alert Inventory Report
Once again using all the techniques seen above this is a alert inventory report that gets all deployed alerts. Allowing us to filter on a number of fields. As well as joining with the active alerts from the “alertsmanagementresources” table. This will show you how many times they’ve fired in the last 30 days as well as the average amount of time each alert has spent open. We can even drop in the action groups from above as well.
resources
| where type =~ 'microsoft.insights/activitylogalerts'
          or type =~ 'microsoft.alertsmanagement/smartdetectoralertrules'
          or type =~ 'microsoft.insights/scheduledqueryrules'
          or type =~ 'microsoft.insights/alertrules'
          or type =~ 'microsoft.insights/metricalerts'
| extend Enabled = iff(isnotnull(properties.state), properties.state, properties.enabled),
                Severity = properties.severity,
                AutoResolve = properties.autoMitigate,
                Query = properties.source.query
| extend Enabled = case(Enabled == "Enabled", "true", Enabled == "Disabled", "false", Enabled)
| extend Condition = properties.criteria.allOf
| extend AlertTarget = case(
                properties.criteria contains 'Microsoft.Azure.Monitor.WebtestLocationAvailabilityCriteria', 'App Insights',
                type =~ 'microsoft.insights/activitylogalerts', 'ActivityLog',
                type =~ 'microsoft.insights/components', 'App Insights',
                type =~ 'microsoft.operationalinsights/workspaces', 'Log Analytics',
                type =~ 'microsoft.insights/scheduledqueryrules', 'Log Analytics',
                type =~ 'microsoft.alertsmanagement/smartdetectoralertrules', 'App Insights',
                type =~ 'microsoft.insights/components', 'App Insights',
                Condition.metricNamespace =~ 'Microsoft.OperationalInsights/workspaces', 'Log Analytics',
                tolower(Condition.metricNamespace))
| join kind=leftouter(
              alertsmanagementresources
                    | extend FireTime = todatetime(properties.essentials.startDateTime),
                                    LastModifiedTime = todatetime(properties.essentials.lastModifiedDateTime),
                                    MonitorCondition = tostring(properties.essentials.monitorCondition)
                     | extend TimeOpen = iff(MonitorCondition == "Resolved", datetime_diff('minute', LastModifiedTime, FireTime), datetime_diff('minute', now(), FireTime))
                     | summarize count(), avg(TimeOpen) by name)
              on name
| extend TimesFired = iff(isnull(count_), 0, count_)
| project-away name1, count_
| extend TargetResource = todynamic(case(
                 type =~ 'microsoft.insights/scheduledqueryrules', properties.source.dataSourceId,
                 type =~ 'microsoft.insights/activitylogalerts', properties.scopes,
                 type =~ 'microsoft.alertsmanagement/smartdetectoralertrules', properties.scope,
                 type =~ 'microsoft.insights/metricalerts', properties.scopes, 'not found'))
| mv-expand TargetResource
| extend ActionGroup = todynamic(case(
                 type =~ 'microsoft.alertsmanagement/smartdetectoralertrules', properties.actionGroups.groupIds,
                 type =~ 'microsoft.insights/metricalerts', properties.actions,
                 type =~ 'microsoft.insights/scheduledqueryrules', properties.action.aznsAction.actionGroup,
                 type =~ 'microsoft.insights/activitylogalerts', properties.actions.actionGroups, ''))
| mv-expand ActionGroup
| extend ActionGroup = case(
                 isnull(ActionGroup), 'No Action Group Assigned',
                 isnotnull(ActionGroup.actionGroupId), tolower(ActionGroup.actionGroupId),
                 tolower(ActionGroup))
| join kind=leftouter (
                 resources
                       | where type =~ 'microsoft.insights/actiongroups'
                       | extend Email = properties.emailReceivers
                       | mv-expand Email = Email
                       | summarize EmailList=make_list(Email.emailAddress) by ActionGroup=tolower(id))
                 on ActionGroup
| extend AutoResolve = iff(isnull(AutoResolve), "N/A", AutoResolve),
Details = pack_all()
| project id, name, AlertTarget, avg_TimeOpen, TimesFired, TargetResource, subscriptionId, Enabled, Severity, AutoResolve, Query, EmailList, Details
Summary
There is a ton of useful information for alerting data in Azure Resource Graph. I haven’t pulled out every possible thing from every possible alert. But with the techniques shown above, you should be able to find anything you want. There is lot of info to build reports for Azure Monitor Alerts. If you’ve actually made it this far, thanks! Send me a shout out on twitter or on my email, billyyork at microsoft dot com. Those of you that have followed my blog for a while, can probably guess what’s probably next.