
You already know summarize in Kusto is pretty magical right? Well if not I’ll be going over some of its awesome sauce. In addition this post is going to talk about make-series and how it compares to summarize and when you might want to use each. Per the usual, my examples will be in Log Analytics.
Summarize
For these examples I’ll be using my solar data I collect with PowerShell.
SolarDaily_CL
| where TimeGenerated > startofyear(now())
| summarize Avg_kW=avg(Wh_d) / 1000, YearToDate_kW=sum(Wh_d) / 1000,
                       MonthToDate_kW=sumif(Wh_d, TimeGenerated startofmonth(now())) / 1000,
                       WeekToDate_kW=sumif(Wh_d, TimeGenerated  startofweek(now())) / 1000,
                       DaysAbove70kW=countif(Wh_d > 70000)
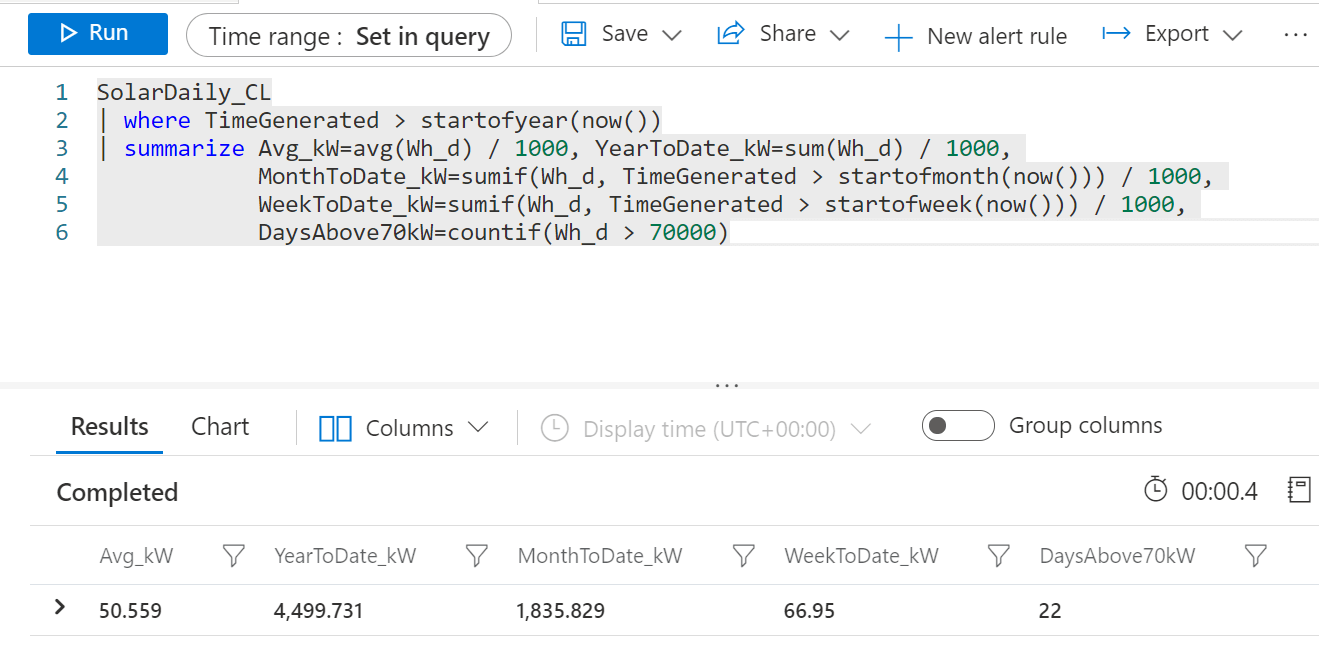
So lets talk about this query. In three lines, yes its 6 but only because I moved part of the summarize down below for readability, I summarized 80+ days of data. I also:
- Renamed every field inside the summarize statement
- Used 4 different aggregators, avg, sum, sumif and countif
- Did division inside the summarize statement
Yea summarize is pretty awesome.
Make-Series
Make-series does some similar things as Summarize, but also is completely different than summarize. It can use many of the same aggregation functions that summarize can. Using the same solar data lets put make a series of the average Wh(watt hours) from the start of the year.
SolarDaily_CL
| make-series avg(Wh_d) on TimeGenerated from startofyear(now()) to now() step 1d
Our result is two fields, one for timegenerated and one for avg_Wh_d.
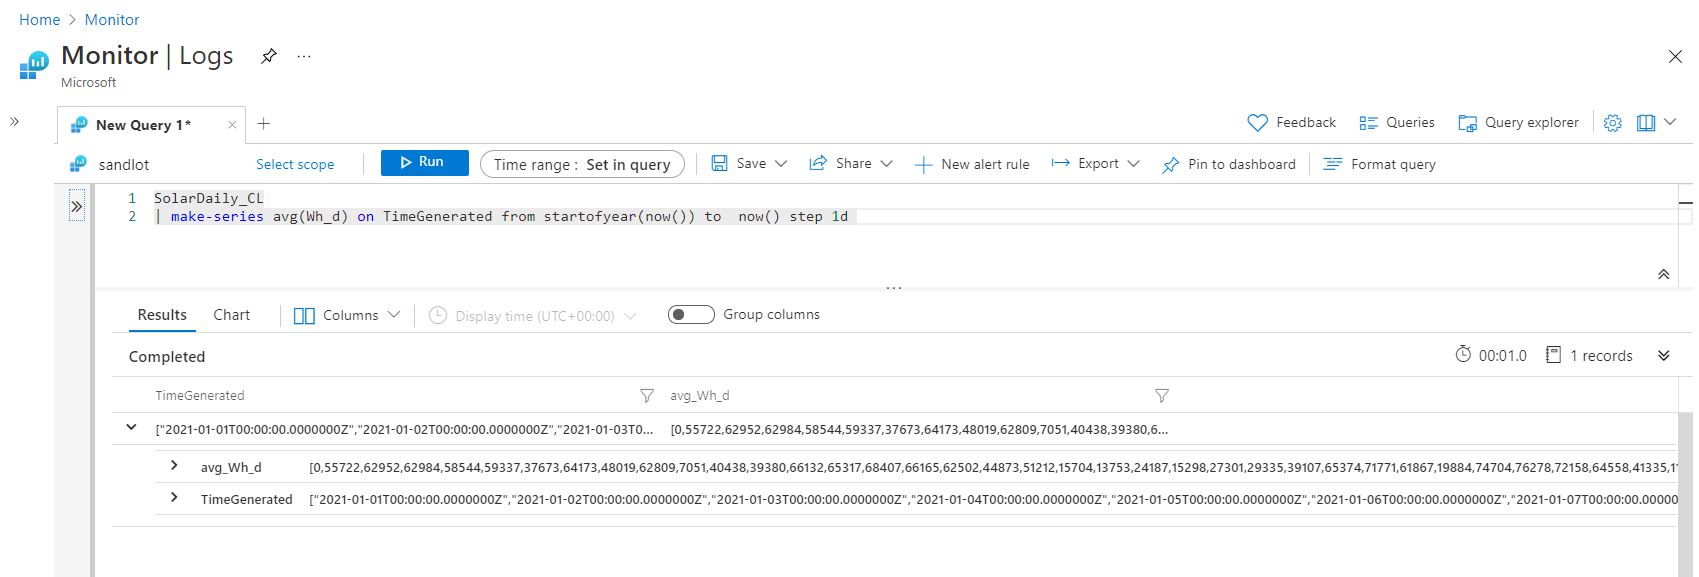
It may not look like much, but click on chart and we have our data in a time chart.
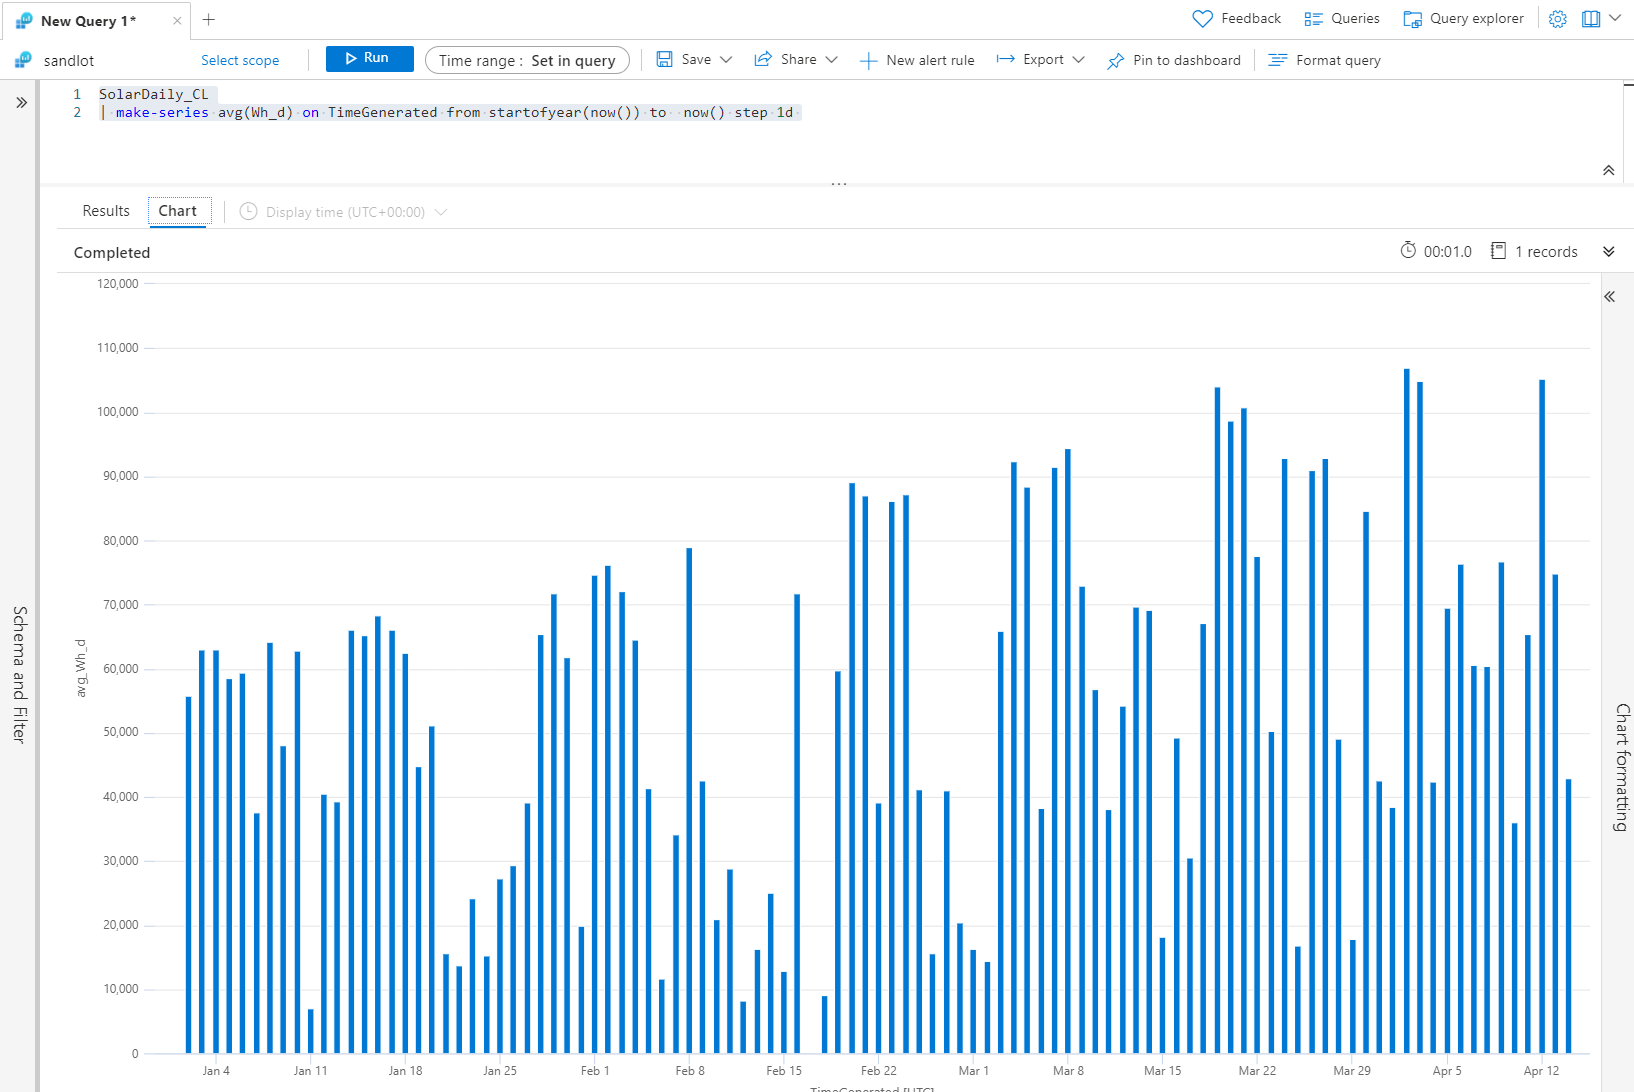
You might be asking but I could have done the same timechart with Summarize by bin(TimeGenerated, 1d) You are correct. There’s always multiple ways to skin a cat in Log Analytics. However, the difference is my most common use case for make-series. Combining summarize and make-series.
Using both queries and adding a extend jkey to each side, we’ll join them together.
SolarDaily_CL
| make-series avg(Wh_d) on TimeGenerated from startofyear(now()) to now() step 1d
| extend jkey = 1
| join (SolarDaily_CL
| where TimeGenerated > startofyear(now())
| summarize Avg_kW=avg(Wh_d) / 1000, YearToDate_kW=sum(Wh_d) / 1000,
MonthToDate_kW=sumif(Wh_d, TimeGenerated > startofmonth(now())) / 1000,
WeekToDate_kW=sumif(Wh_d, TimeGenerated > startofweek(now())) / 1000,
DaysAbove70kW=countif(Wh_d > 70000)
| extend jkey = 1 ) on jkey
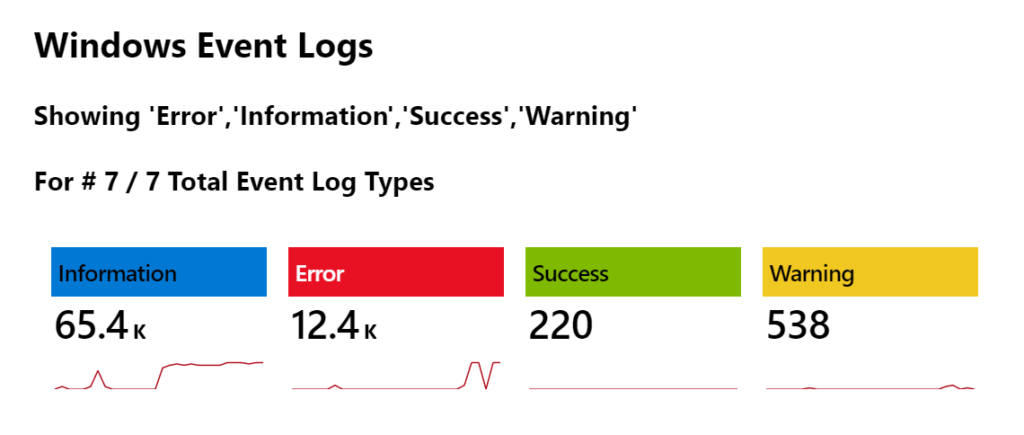
Taking this to Azure Workbooks, we now have all our data from the first query and a spark line of data.
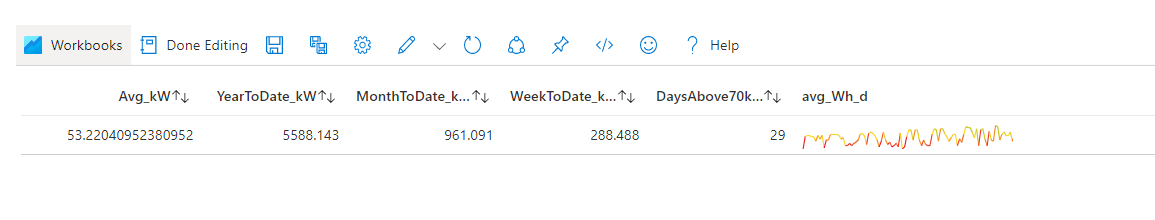
This is the exact same technique I used in my Syslog Workbook and Event Log Workbook. (Event Log workbook pictured)
Note: summarize make-set will produce a similar result, without the time series data.
Advanced Make-Series
That is not all make-series is good for by a long shot. Once we have a series, we can do a number of analysis tasks against it. Like decompose anomalies, outliers, fit line, fill forward and more.
This example uses series stats dynamic, which returns avg, len, max, max_idx, min, min_idx, stdev, sum, varianace.
SolarDaily_CL
| make-series avg(Wh_d) on TimeGenerated from startofyear(now()) to now() step 1d
| project stats= series_stats_dynamic(avg_Wh_d)
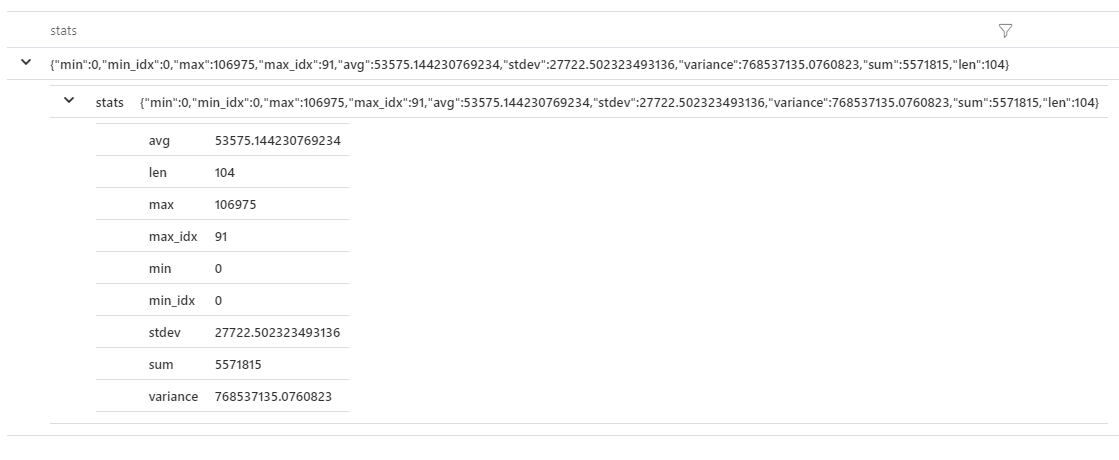
This gets us some of the same info from our first summarize query, but it also brings back the length of time of the data, in this case 104 days, the max output 106kW, the day of our max output, 91, the sum, stdev and variance.
We can also use make-series to have Kusto make an educated guess on what’s going to happen next based on previous data. With series decompose forecast.
let days = 14d;
SolarDaily_CL
| make-series avg(Wh_d) on TimeGenerated from startofmonth(now()) to now()+days step 1d
| extend forecast = series_decompose_forecast(avg_Wh_d, toint(days/1d))
| render timechart
First I’ve switched to start of month for readability, and added a days parameter, to which we add +days to now(), this tells make-seires to make a series from the start of month and two weeks from now. Those values will be zero until we add in series decompose forecast with our make-series field, and days divided by 1d in our case.
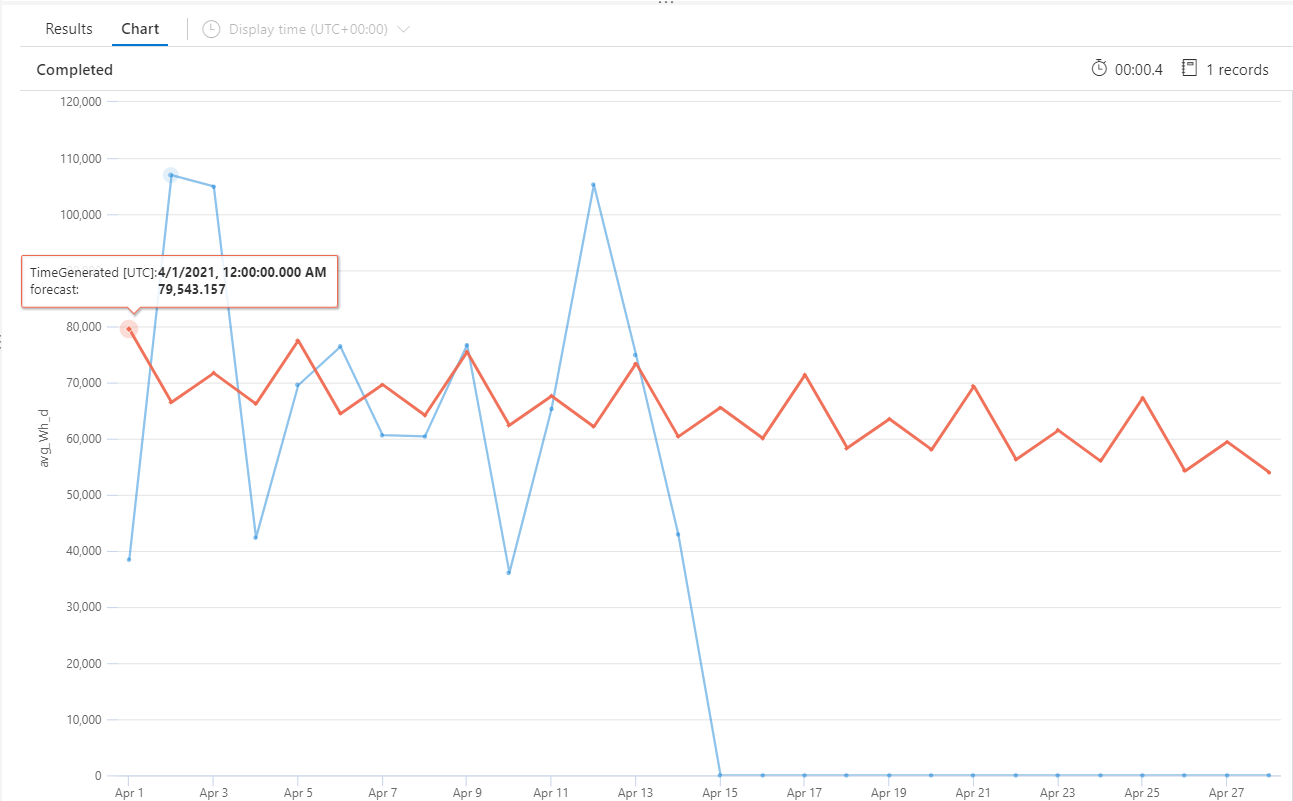
You can see its made 14 more guesses at what’s going to happen based on the data I provided it. Granted for solar data this is only half the data, to get a true guestimate we would need to include some weather data and forecast data. That may be a later blog post.
One more example, recently my colleague Brian Barrington reached out because a customer wanted to know when data didn’t come in for a specific day. This is always an interesting conundrum, how do you alert that you didn’t get something over a period of time? If data stopped coming in you could simply use summarize max(timegenerated) and alert when its greater than your threshold. But in his case data still comes in daily.
let Data=datatable (metric:int, timestamp:datetime)
[1, datetime(2021-01-01 12:30:00),
2, datetime(2021-01-02 13:30:00),
3, datetime(2021-01-03 12:30:00),
4, datetime(2021-01-04 13:30:00),
5, datetime(2021-01-05 12:30:00),
6, datetime(2021-01-06 12:30:00),
7, datetime(2021-01-07 13:30:00),
8, datetime(2021-01-08 12:30:00),
//9, datetime(2021-01-09 12:30:00),
10, datetime(2021-01-10 12:30:00),
11, datetime(2021-01-11 12:30:00),
//12, datetime(2021-01-12 12:30:00),
13, datetime(2021-01-13 11:30:00),
14, datetime(2021-01-14 12:30:00),
15, datetime(2021-01-15 13:30:00)
];
let interval = 1d;
let stime = datetime(2021-01-01 00:00:00);
let etime = datetime(2021-01-16 00:00:00);
Data
| make-series count(metric) on timestamp from stime to etime step interval
| mv-expand count_metric
| where count_metric == 0
| count
When you take data into make-series any empty or null values are represented by 0. So we can then use mv-expand and now we’ll have 0’s that we can alert on, where count of 0’s is greater than 0.
Conclusion: Kusto Make-series vs Summarize
Summarize is awesome and probably one of the most used functions in Kusto. Make-series is useful when combining with summarize as well as very useful for time series analysis and doing statistical analysis directly in Kusto.