Every Windows admin knows “check the logs” right? RIGHT? No one actually likes looking at each servers individual Event Log. At least I never did, even remotely its difficult, and switching context between log sources is a pain as well. Well Log Analytics can collect those event logs. And because Log Analytics can collect those logs that means we can do all kinds of fun stuff with them. In this instance I’ve built a Workbook in Azure Monitor to search any Event Log from any computer with any event level. All in one place. This will work with any Windows server that you have the Log Analytics agent installed on. Whether those servers are in Azure, on-prem or another cloud. No, you don’t need to use Azure ARC either.
Choose your Event Logs
In Log Analytics under Advanced Settings -> Data -> Windows Event Logs you can choose your Event Logs. 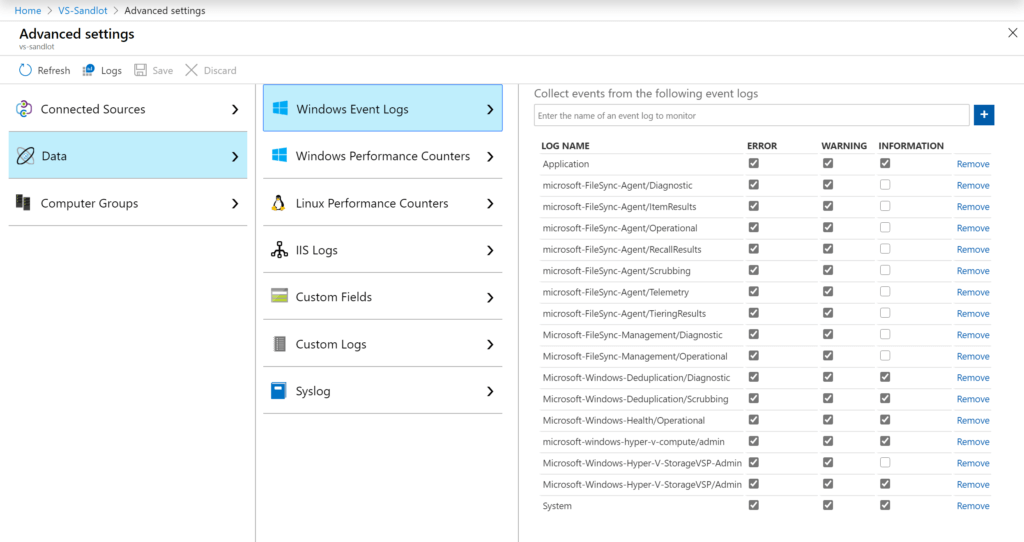
Parameters
This Workbook is entirely parameter based. This makes the workbook completely dynamic. I went over many of the types of parameters you can make in my Azure Advent Calendar video. One I didn’t show was that you can create parameters directly from Log Analytics data.
The first parameters, Subscriptions, TimeRange, Workspace are used in all the parameters and widgets.

The next set of parameters are all for controlling what data is visualized from your event logs. These are also entirely dynamic. For instance if only one Source type is collected that’s the only Event Source that will be visible in the parameter. Additionally Event Source is used in the Event Log parameter.
First we can set our Computer to Any, All, or select one machine. If you select one machine to use, the available Event Logs will be limited to that one computers logs.
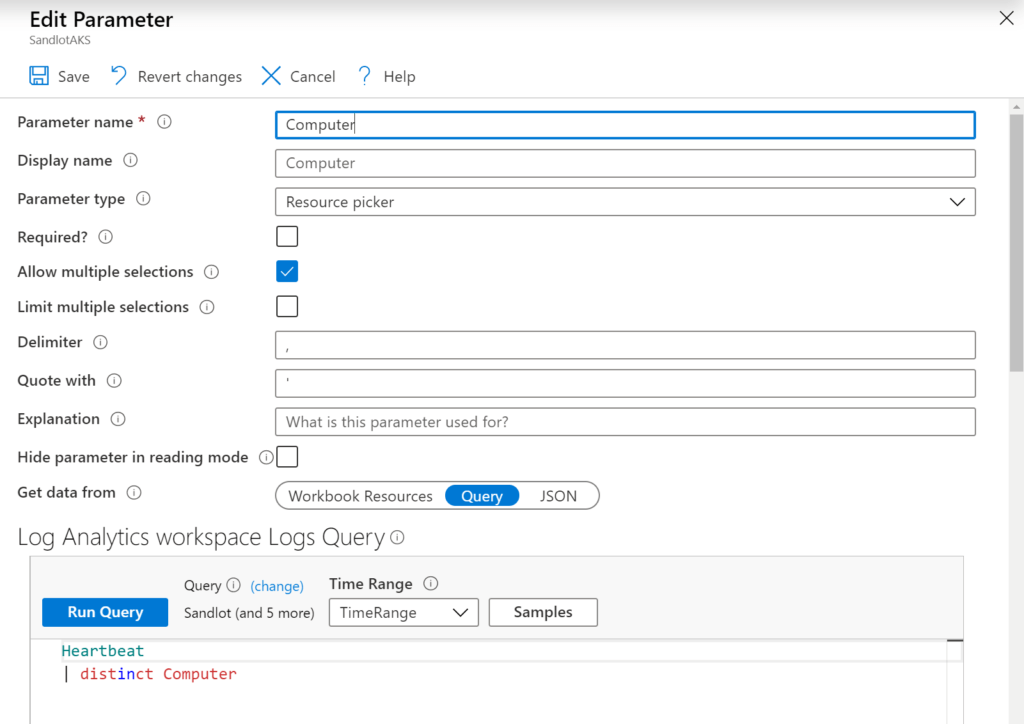
For our Event Source you can see the Computer is a parameter in the query itself.
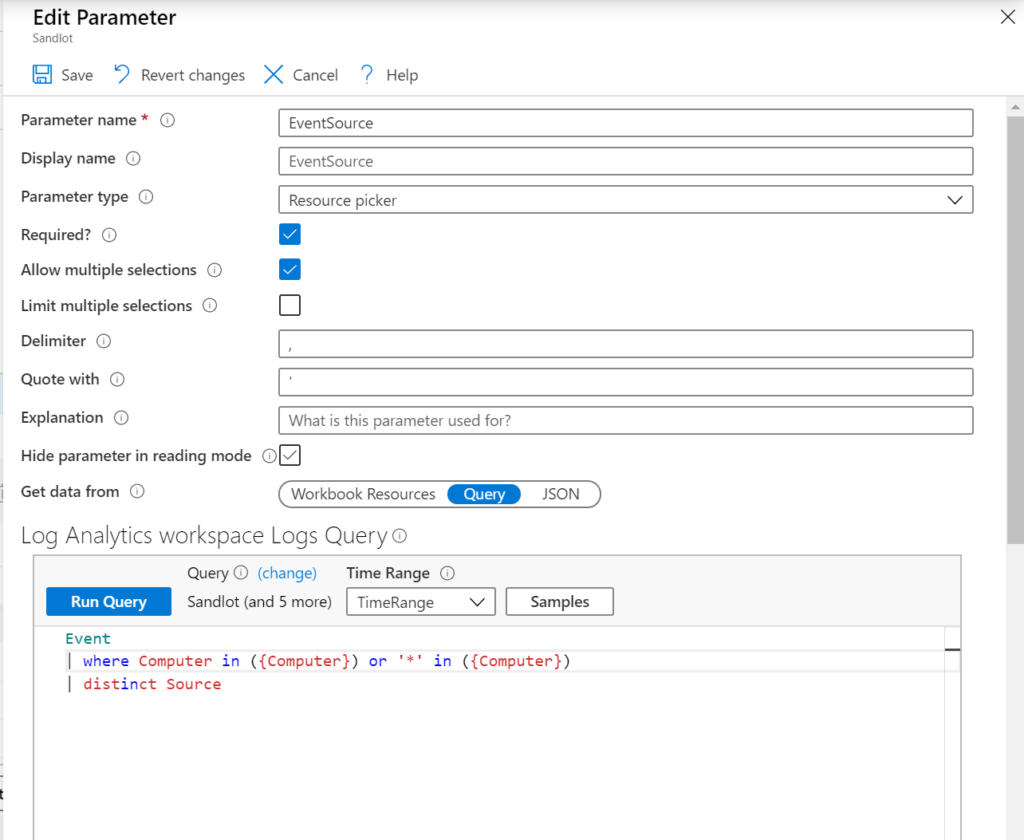
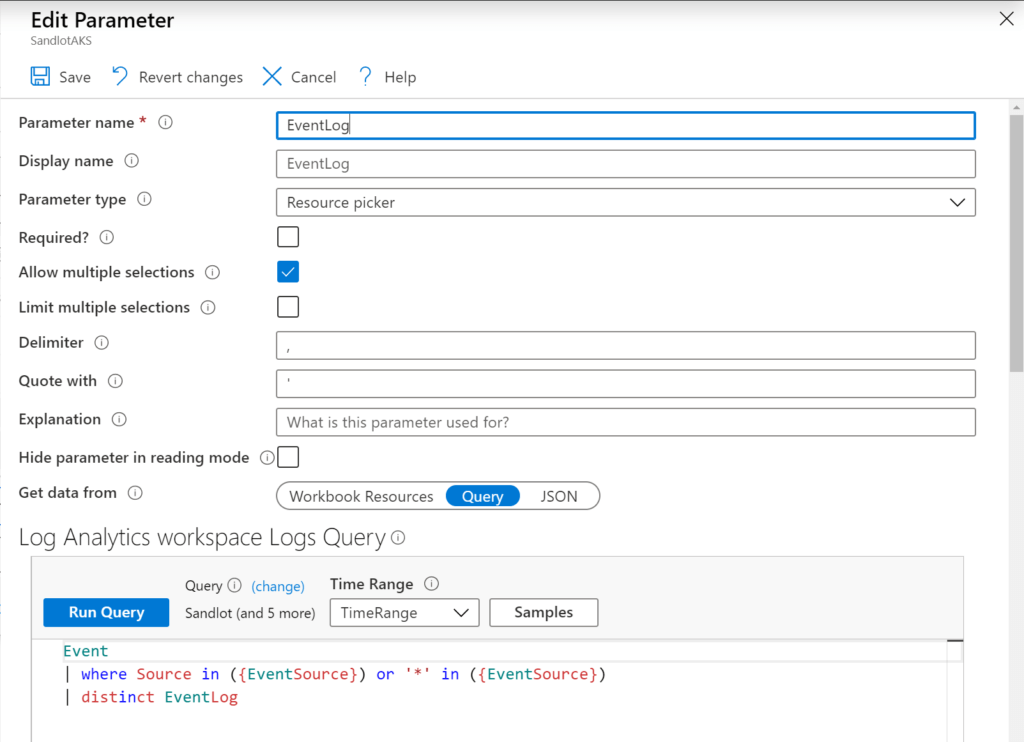
Next we have EventLog, which as you can see from the query, relies on EventSource. So EventSource needs to be set before you can set EventLog.
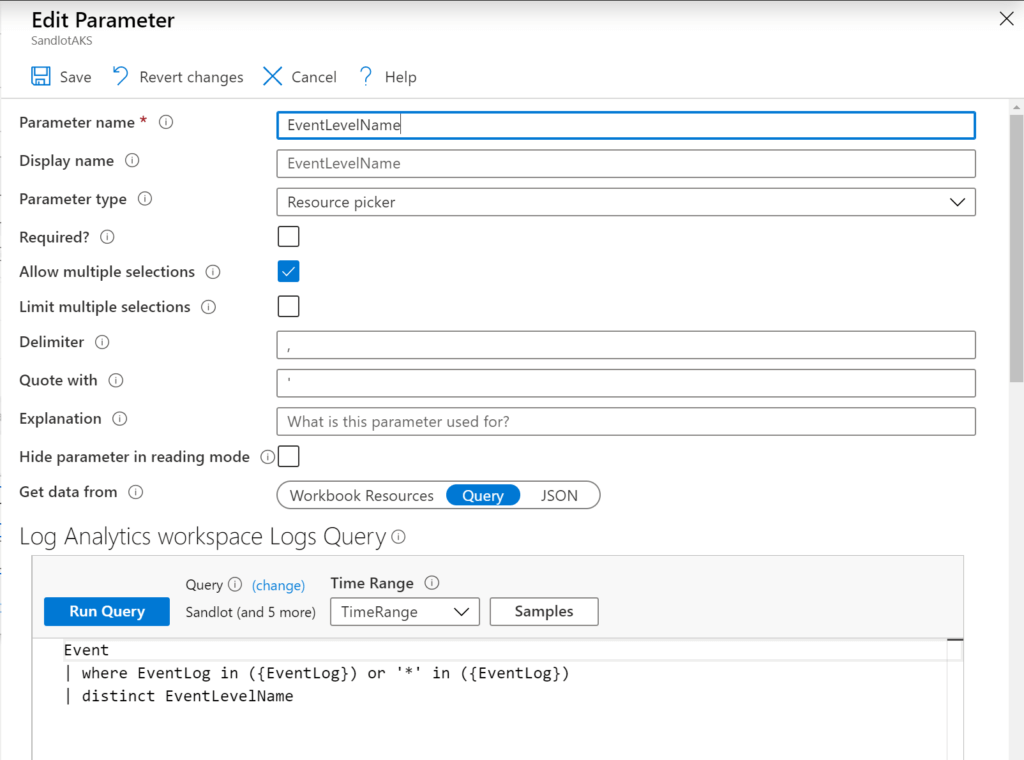
Similarly, EventLevelName relies on EventLog, this will get all Event Levels in the event logs.
The Event Log Workbook
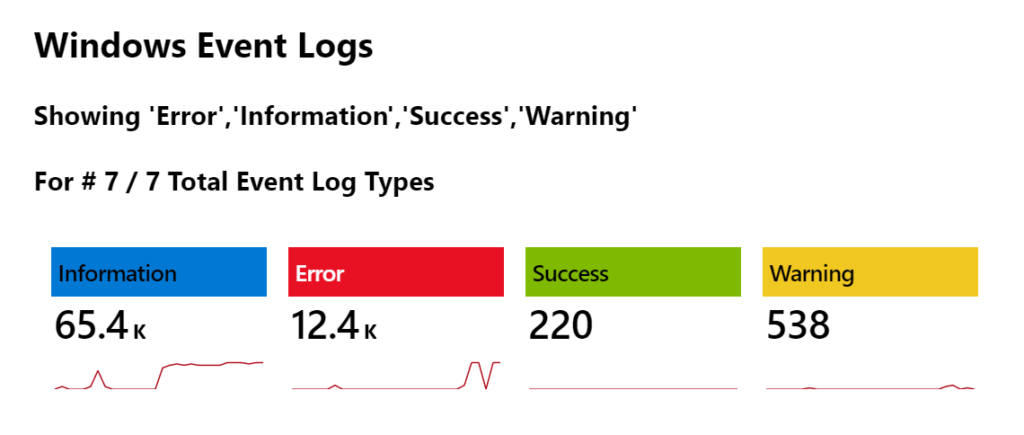
After our Parameters we have some dynamic text and tiles. Depending on what event level and event logs you select the text will change to show the event level you selected and the total count of event logs you’ve selected.
After that we have tiles sorted by Event Level type, with color coding thresholds, counts and a trend line.
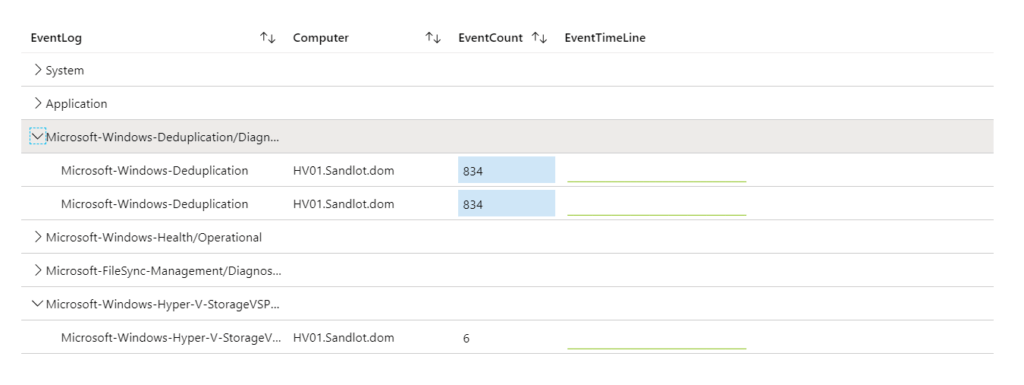
The next widget is a grid view grouped by Event Log, with counts for servers and a trend line per server.
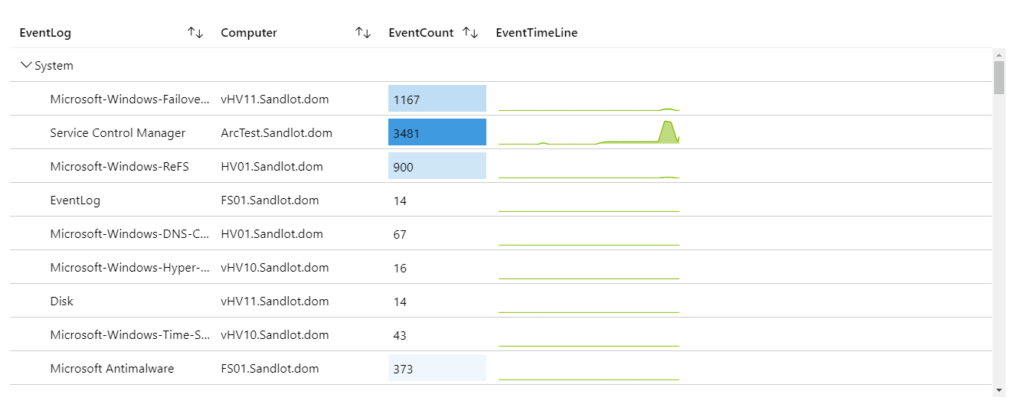
You can expand and collapse the event log types.
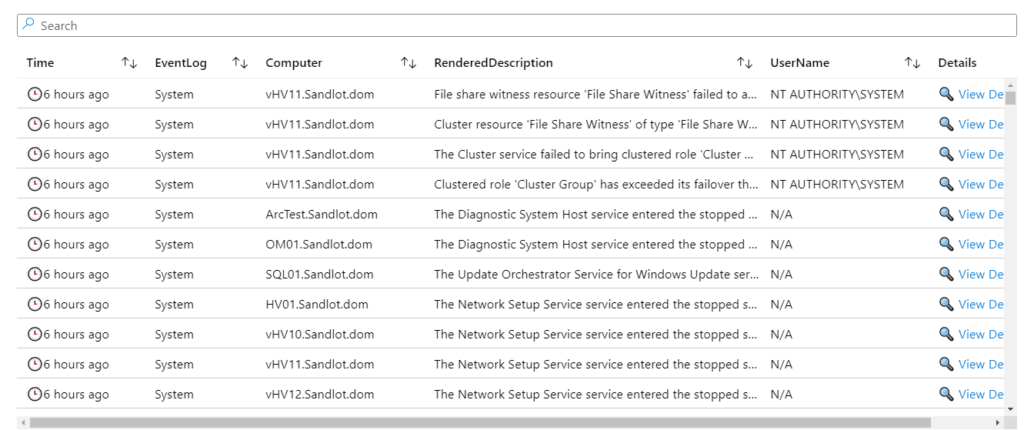
Finally we have a view of the logs by time generated.
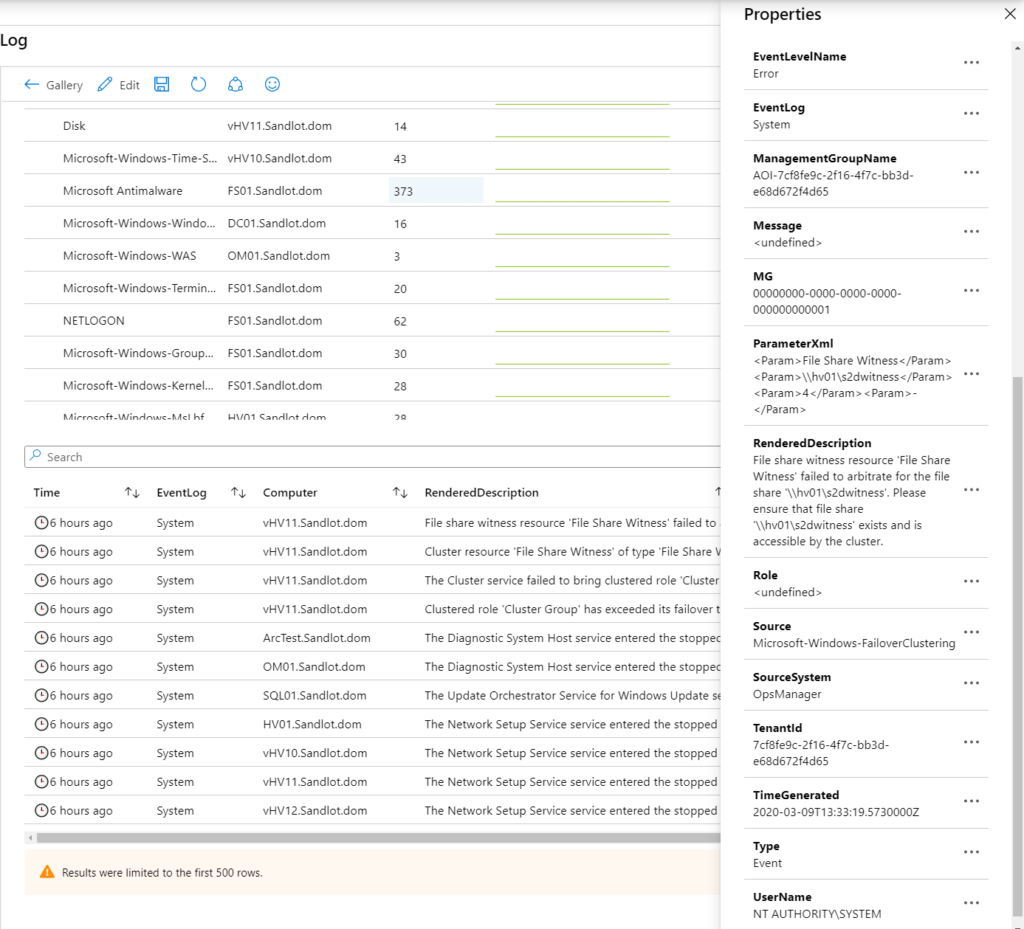
You can click on “View Details” to open the side blade and see all fields available for that specific log.
Github repo with the templates. https://github.com/scautomation/Event-Log-Workbook
