Something I’ve been working on off and on was a LogicApps workbook for Azure Monitor. The view designer dashboard, was always in preview and kind of bad. Donnie’s recent post in our series inspired me to finish it. Especially since we’ve gotten confirmation that the view designer is going to be phased out.
This workbook uses Azure Resource Metrics and Diagnostic Logs for LogicApps. So you’ll need to set that up on any LogicApp you want to use. Or you can use an Azure Policy to do that as well.
Parameters
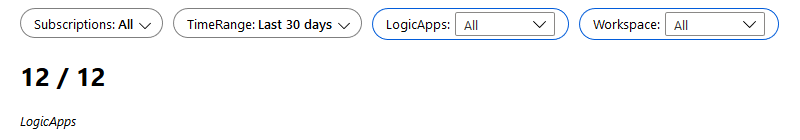
The workbook has 4 Parameters at the top: Subscriptions, TimeRange Workspace and LogicApps. The available LogicApps and Log Analytics workspaces in their drop downs is defined by Subscriptions.
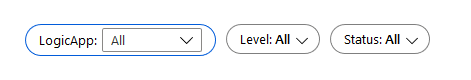
There are also 3 Parameters for Logs: LogicApp, Status, Level.
Metrics
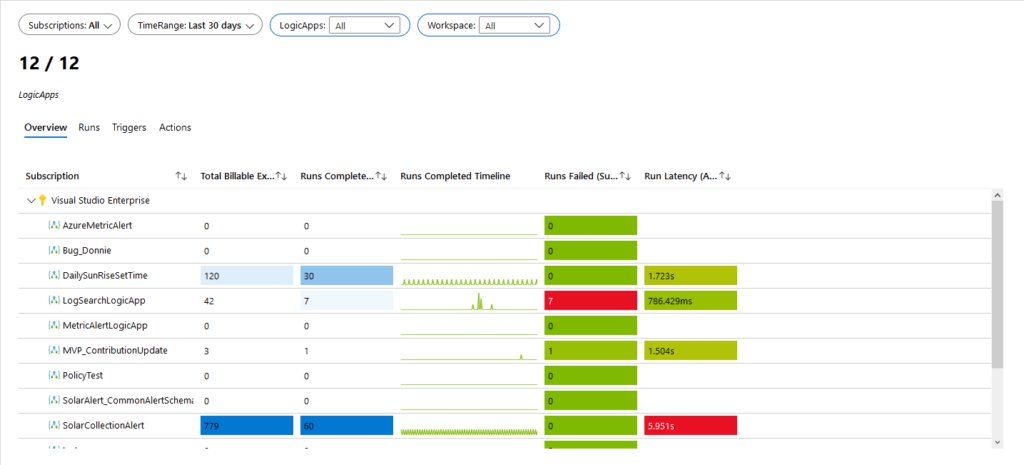
There are a number of metrics being published off of LogicApps. Which allows a lot of visualizations as well as alerts. I have separated them out into Tabs.
An Overview Tab, providing Total Billable Executions, Runs Completed, Failed, and Latency.
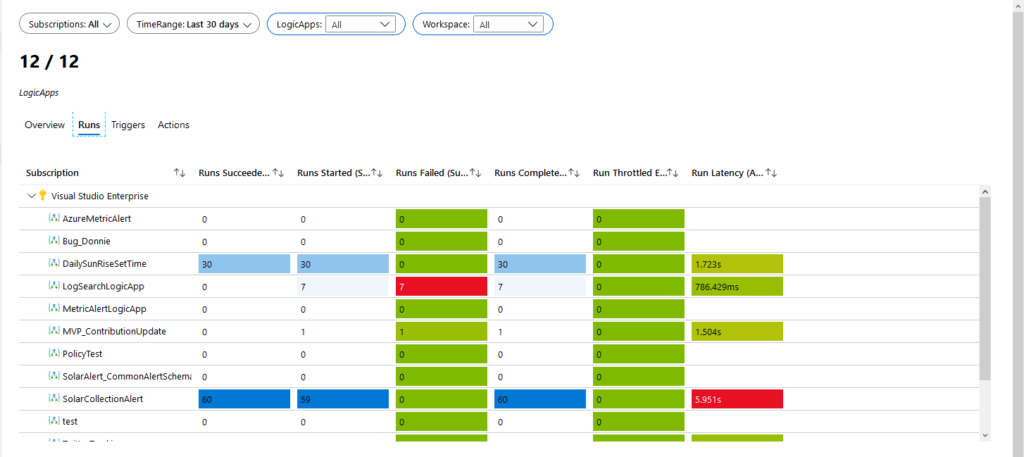
A Runs Tab, with more metrics around LogicApps runs.
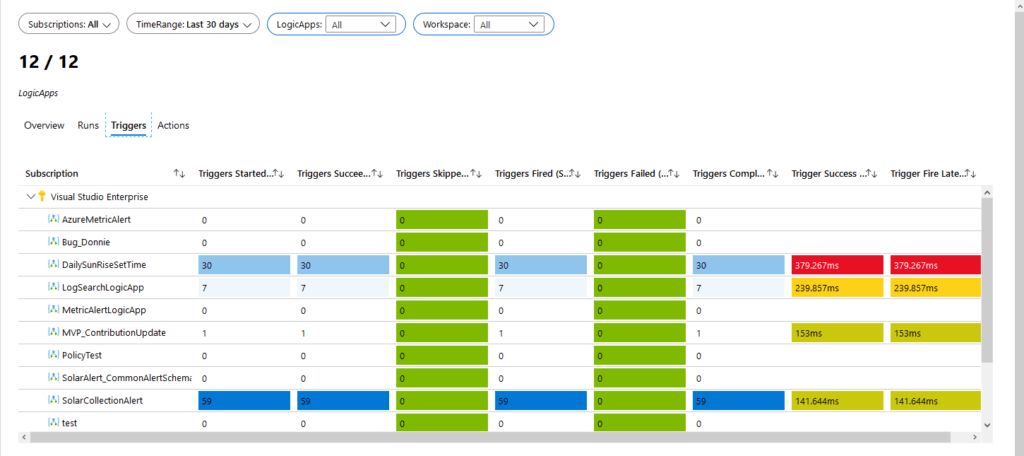
Triggers Tab, that has success, skipped, success latency and more.
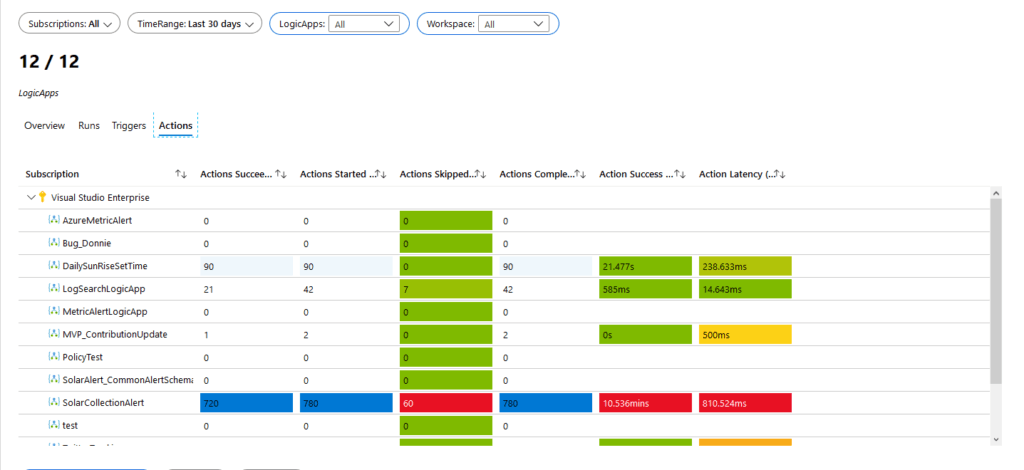
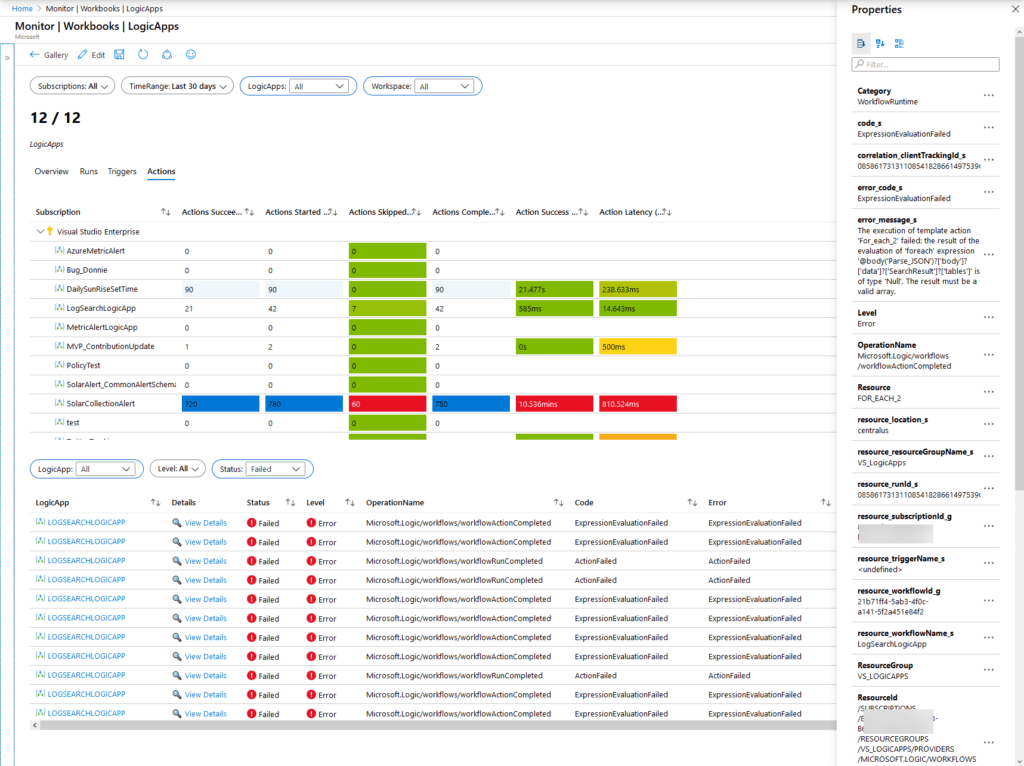
Actions Tab, with success, started, skipped, success latency and total latency.
Logs
We’re also grabbing logs, the parameters are set from the logs themselves. So you can sort by a specific LogicApp, or by status or level.
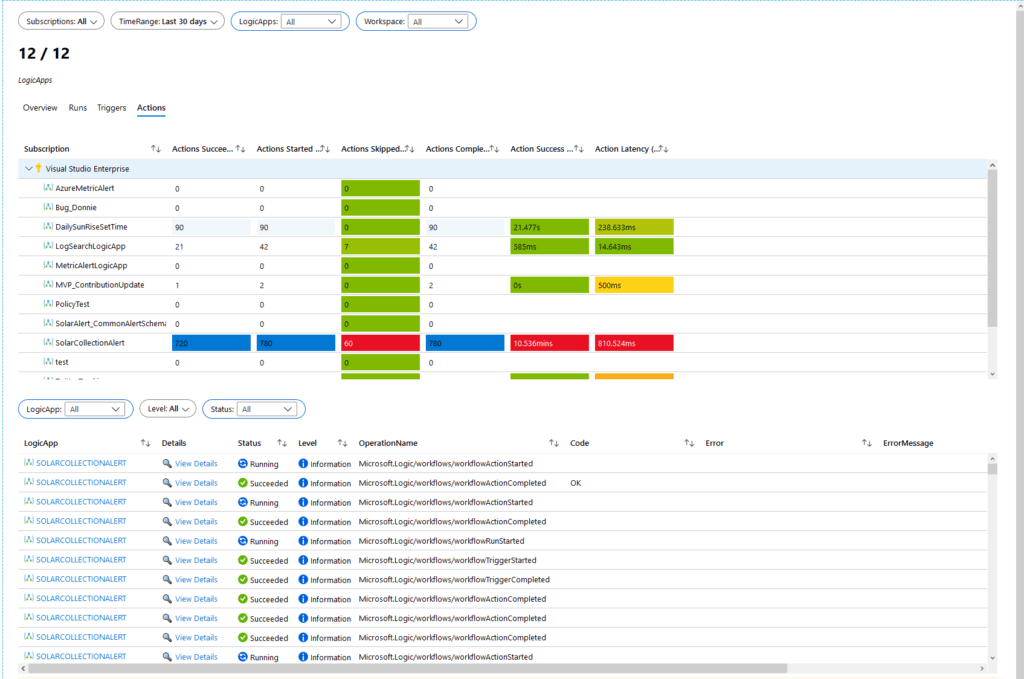
The view details columns bring sup the side blade with the full information for the log.
This will work for all LogicApps and Azure Sentinel “Playbooks” which are just LogicApps.
As always you can find my Azure Monitor Workbooks and this one for LogicApps on my github. Try it out and let me know what you think.