Within Azure Monitor, we have Log Analytics, and within Log Analytics we have a number of solutions. One such solution is the Change Tracking Solution. You might ask, what does “change tracking” have to do with Windows or Linux service/daemon monitoring? Funny you ask. I’ll get to that in a minute, first lets get the Change Tracking Solution setup.
What You’ll need:
- Log Analytics workspace
- Azure Automation Account
- Log Analytics and Azure Automation Accounts Linked
You can deploy the solution via an ARM template, and I’m currently working on setting up ARM templates for all the solutions for Log Analytics. For now, I’ll show how to do it through the Azure GUI.
Setup Change Tracking Solution
Within the GUI there’s two main ways to enable Change Tracking
From Log Analytics
From Log Analytics, go to Workspace Summary, click on Add and in the right hand side blade, you are greeted with a scroll-able list of available solutions.
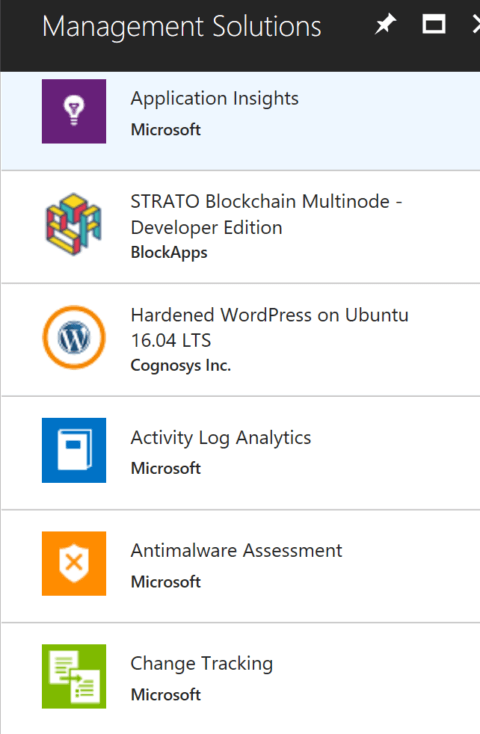
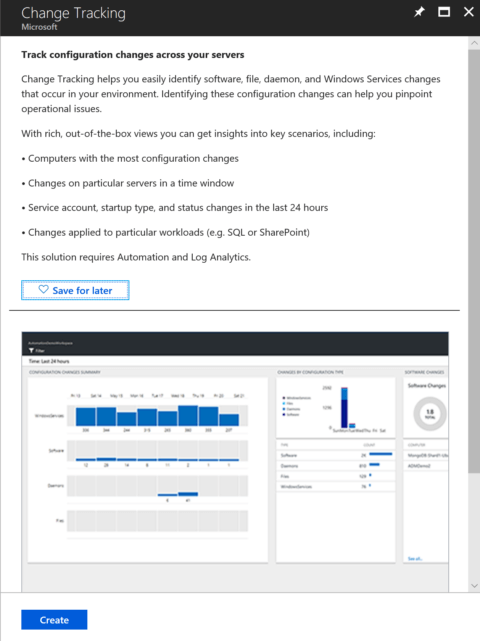
Selecting Change Tracking opens up its description.
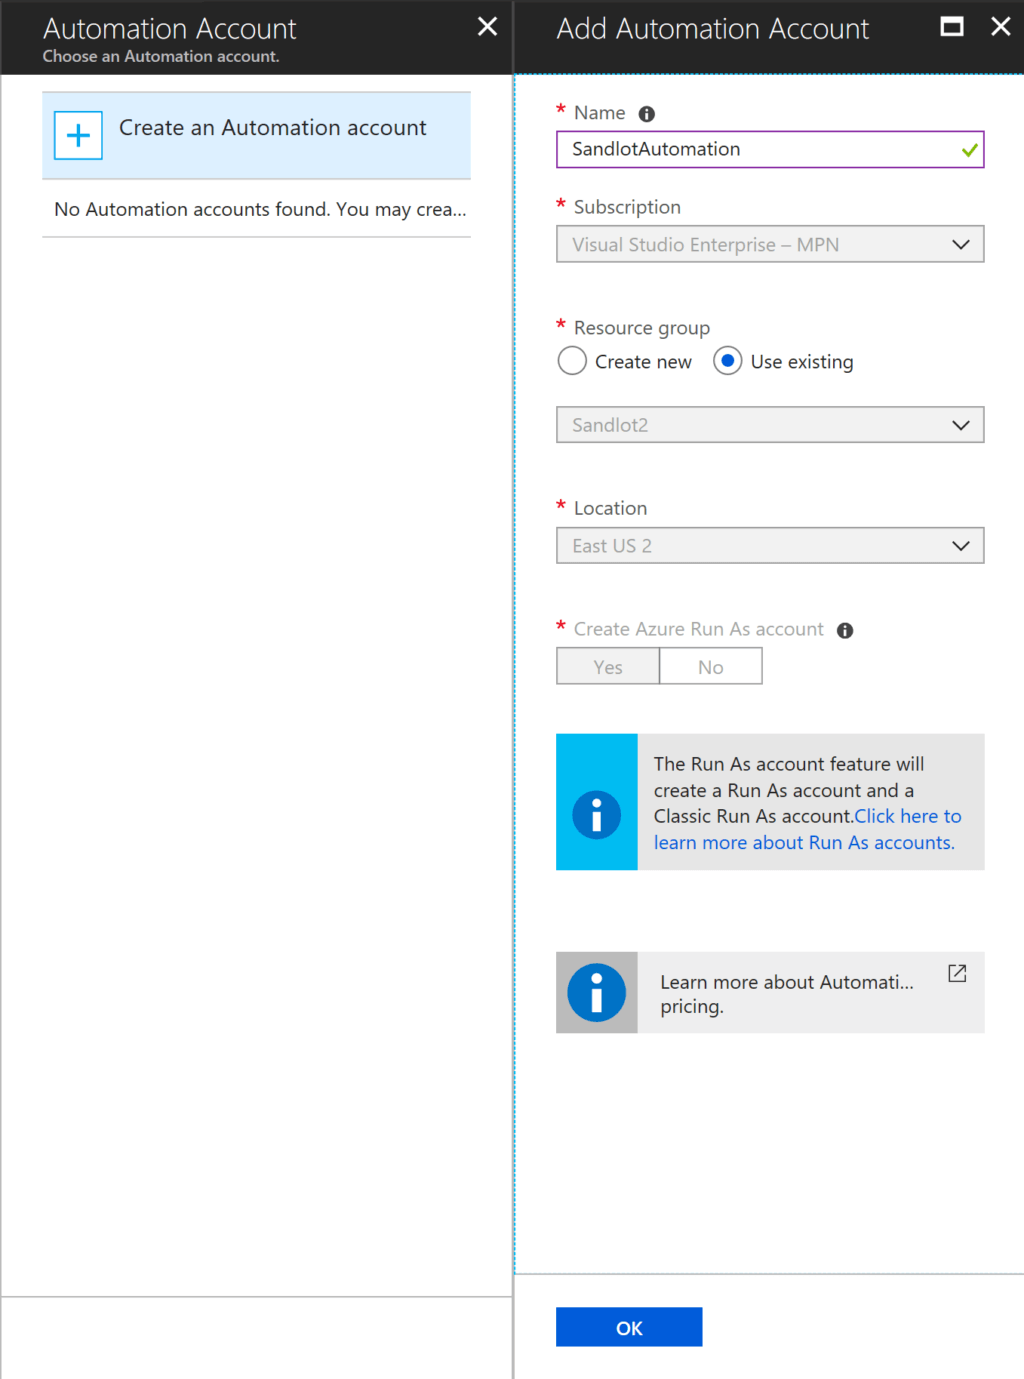
Clicking on Create will bring up the below menu. As you can see I did not have an Azure Automation Account linked to my Log Analytics workspace. This will give you the option to create the Automation Account.
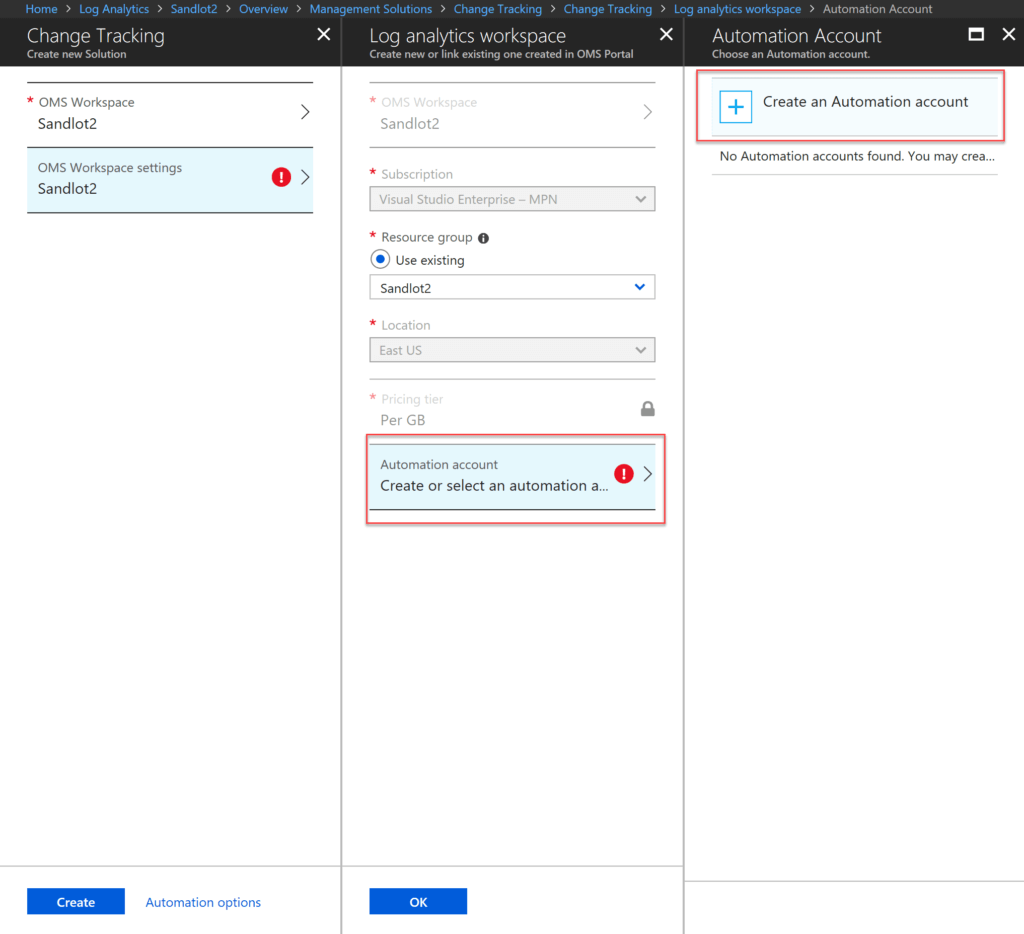
Create the Azure Automation account, Azure will deploy it and validate, once validated you can create the Change Tracking Solution.
Enable from Azure Automation Account
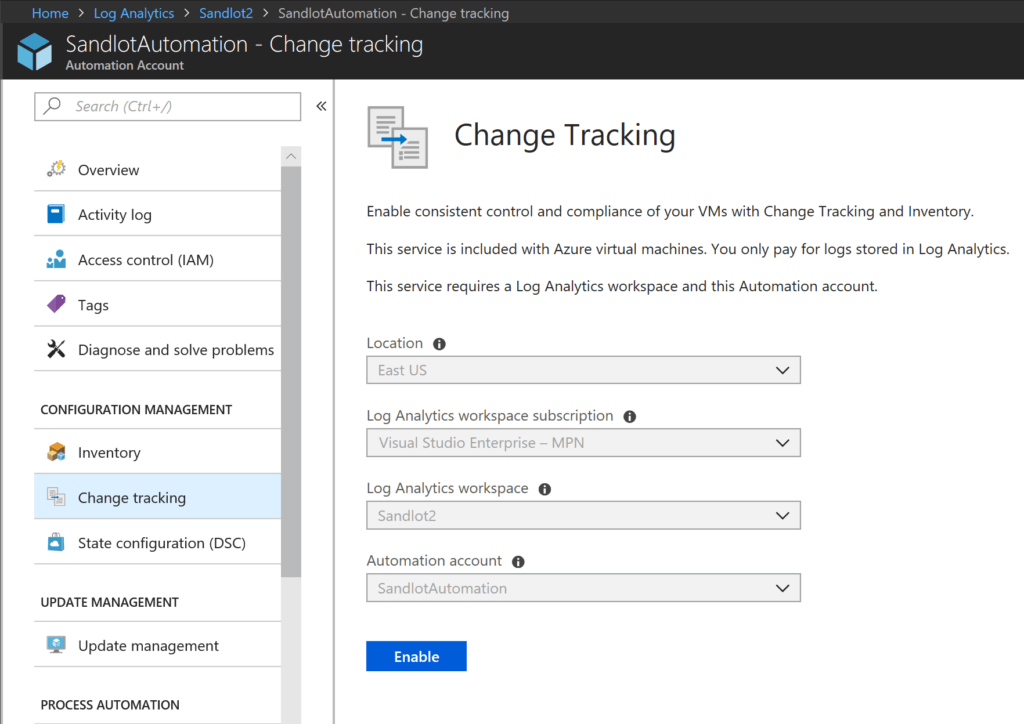
For Log Analytics workspaces that already have an Azure Automation Account linked, I find it easier and faster to simply go to the Automation Account, select Change Tracking and then select Enable.
Configuration and Log Data
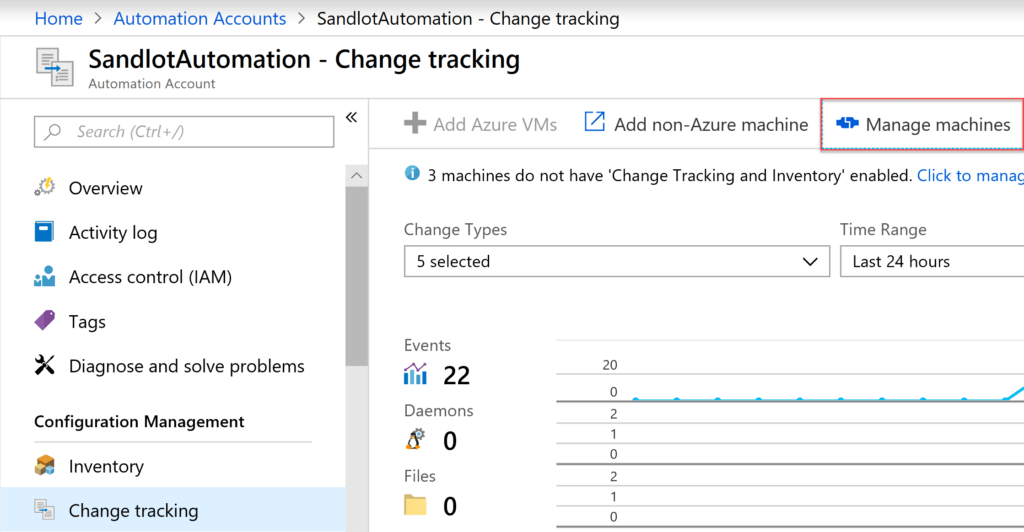
Once setup you still need to attach machines to the solution. These machines need to already have the MMA/Azure Monitor agent installed. Go to the Change Tracking tab and then select Manage Machines.
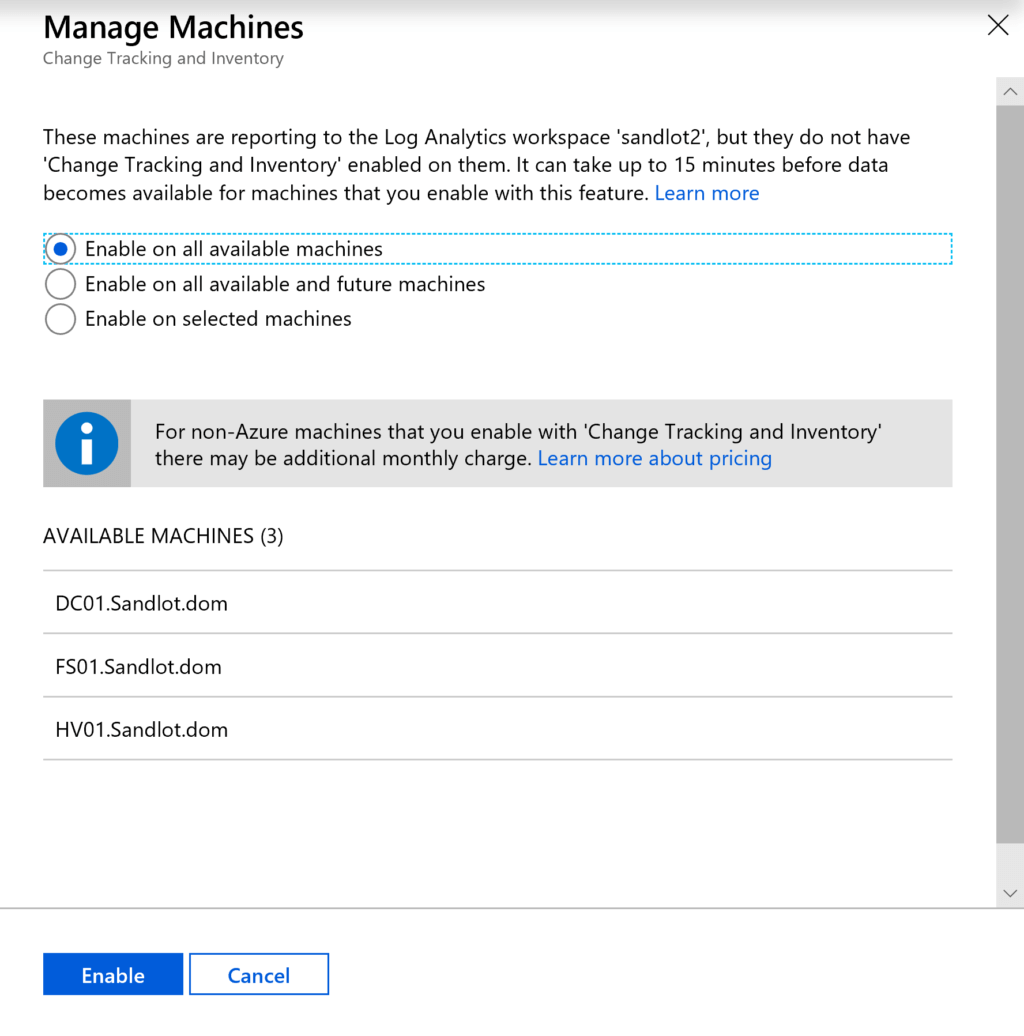
You get a blade to the right asking how you would like to configure.
In my opening I asked what does Change Tracking have to do with Windows Service or Linux Daemon monitoring? For Linux, currently the default is 5 minutes. For Windows, however, it can be taken down to 10 seconds.
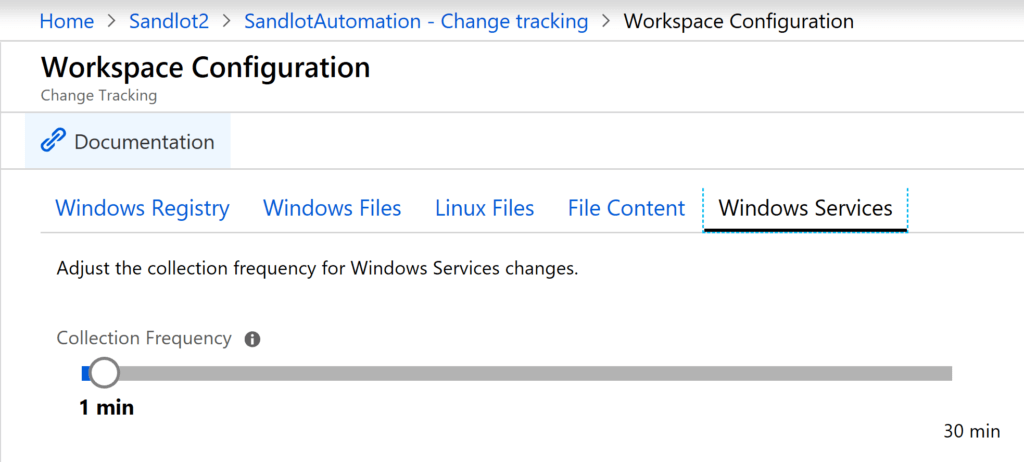
The key here is that the agent is not sending a status every 1 minute, as I have it set in my environment. It checks the services every minute, but only sends data to your workspace when something changes. IE a service goes from running to stopped.
When you enable this solution you get two new tables in Log Analytics, ConfigurationData and ConfigurationChange. Using the awesome usage query from Christoph Peterson, found here. You can see the usage for the last 30 days, for the two computers I have enabled the solution for.

That’s not bad, and again the good part about the solution is that it does not automatically get enabled for all machines in your environment. You can enable it only for key servers where you want to monitor their services.
Sample Queries
After a few hours to a day you should have all your services from the computers you added in Log Analytics. Like I said above the agent typically only sends data when a service state changes, that said it does seem to send in a update every 24 hours or so if no changes were made.
ConfigurationData
| distinct Computer, SvcName
Using distinct you can get all the services for all the computers you’ve added.
Now, lets say we want to monitor the Windows World Wide publishing service, otherwise known as the IIS Role on your servers. In the below code I’m getting the service for only my SCOM server, and returning only if the Service is in any other state than Running.
ConfigurationData
| where Computer == "OM01.Sandlot.dom"
       and SvcName =~ "W3svc"
| project SvcName, SvcDisplayName, SvcState, TimeGenerated
| where SvcState != "Running"
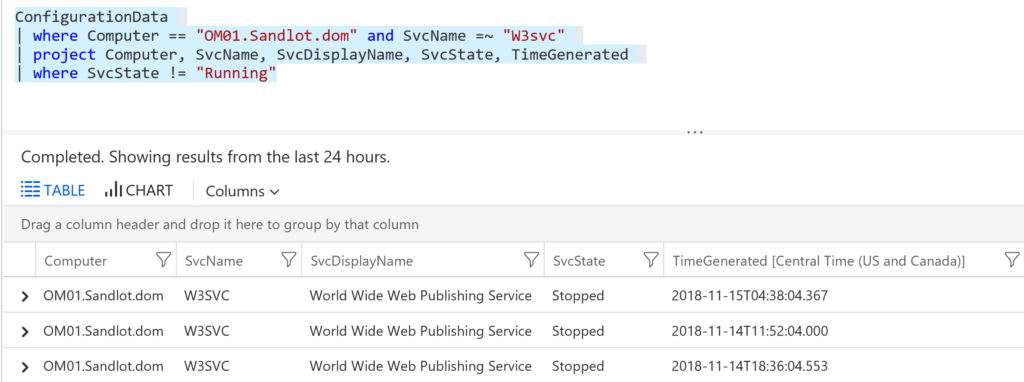
To monitor the same service on any machine simply remove the Where Computer ==
ConfigurationData
| where SvcName =~ "W3svc"
| project Computer, SvcName, SvcDisplayName, SvcState, TimeGenerated
| where SvcState != "Running"
This will monitor that service on every machine you put into the Change Tracking Solution.
Another query I envisioned was taking a set of servers with specific services to create an over all service health for an application or infrastructure service.
ConfigurationData
| where (Computer == "HV02.Sandlot.dom")
         or (Computer == "HV01.Sandlot.dom")
| where (SvcName =~ "vmms")
         or (SvcName =~ "vmcompute")
| project Computer, SvcName, SvcDisplayName, SvcState, TimeGenerated
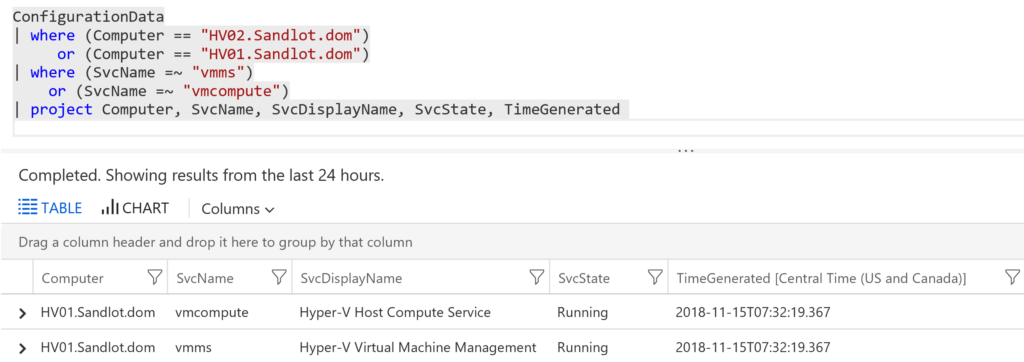
I don’t have an hv02 server yet, but if I did it would certainly show up here. To add the alert portion of the query simply add
| where SvcState != "Running"
to the bottom of the query. Now if any service on any of the listed machines fails we will get an alert, after we create the alert in Azure Monitor.
There are many other properties that the agent collects, like Startup Type, which you can build around. Say if you wanted to monitor all “automatic” startup types on a server or servers. Or all the “automatic delayed start” services.
Azure Monitor Service Monitoring Summary
For this post I have only covered one section of what the Change Tracking Solution can actually monitor. Change Tracking can actually monitor:
- Windows Registry
- Windows Files
- Linux Files
- Windows and Linux Software
Check out this page for more information on the solution. https://docs.microsoft.com/en-us/azure/automation/automation-change-tracking
