Today I’m excited to finally share with you something that I’ve been working on for weeks. This project entailed many many hours of work. It is, An Azure Inventory Dashboard using Azure Monitor Workbooks. The original version of this Workbook was shown in my Workbooks video I made last year. In that same video I detail all the different resources you can query besides Azure Monitor resources, one of which is Azure Resource Graph. If you’re unfamiliar with Workbooks, that video is a good starting point on familiarizing yourself with them.
TLDR: here’s the github for the Workbook
You can see video demo of the workbook as well has how to import workbooks here. Thank you to Richard and Gregor for hosting it on CloudFamily youtube channel. You can check out the website here. https://cloudfamily.info/
or embedded
The workbook is broken up into several sections, each bolded section here represents a Tab within the workbook. The only top level parameter is subscriptions. And yes this workbook works with Azure Lighthouse.
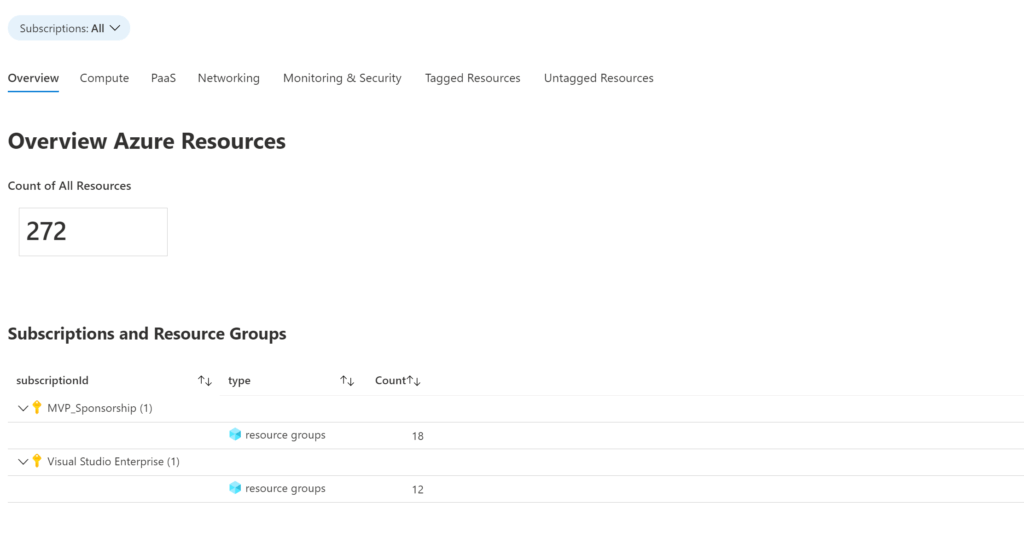
Overview
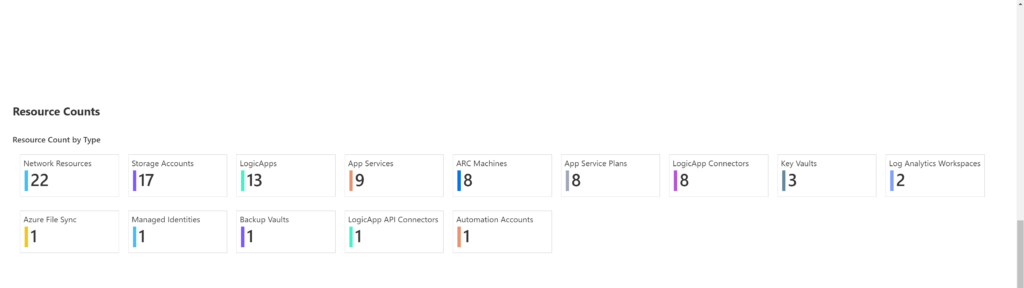
The overview provides a count of all resources, a breakdown of Subscriptions and resource groups per subscription. And a count of resources by type.
Note everything is a resource in Azure, so 1 VM could have multiple NICs, disks, and Public IPs for instance all of which each count as their own resource.
This presented its own challenges throughout the workbook. Do I show NICs as a resource count in the overview? Does this resource type go with that resource or this resource type? Ultimately I decided on the overview to give a basic overview since I have also included detailed breakdowns throughout the workbook. So all network objects are included under one resource type in the overview, but broken down under the networking tab. Similarly there are several different types of App Services, which are broken down under PaaS – App Services.
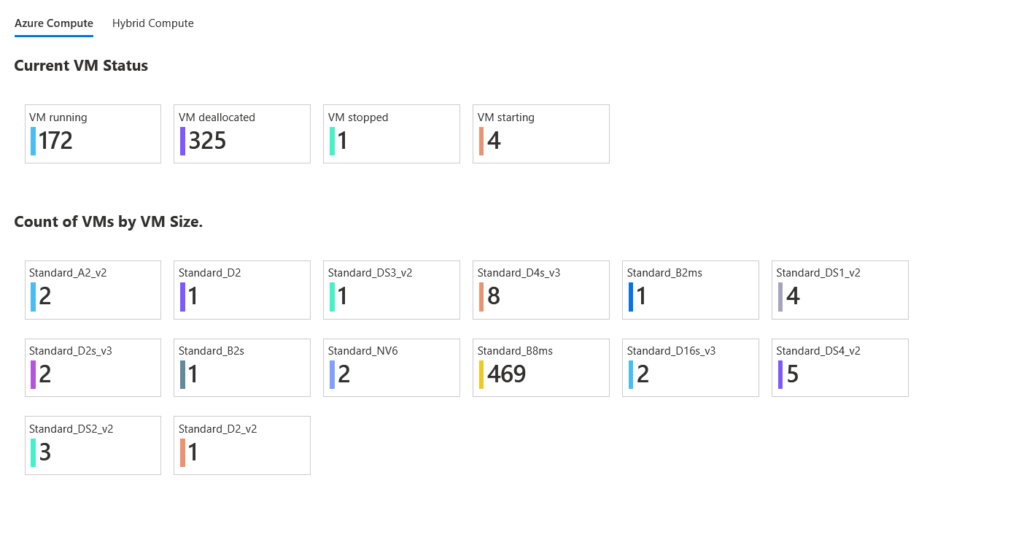
Compute
With Compute, we get a breakdown of Azure VMs current status and a count of VMs by size at the top.
And then networking details of our VMs with Private IP as well as Public IP
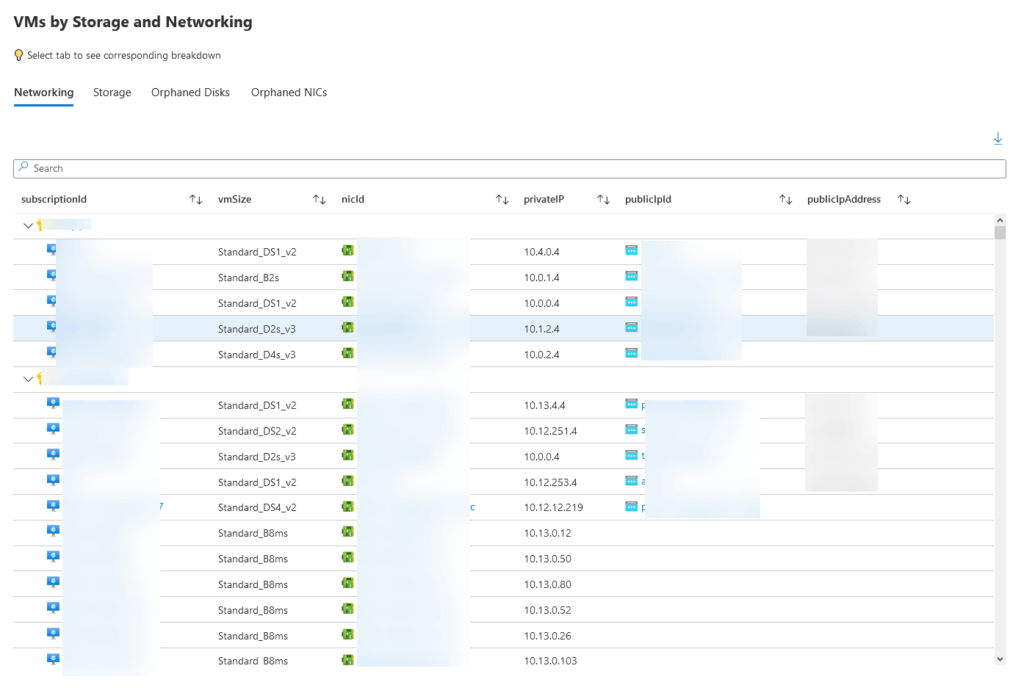
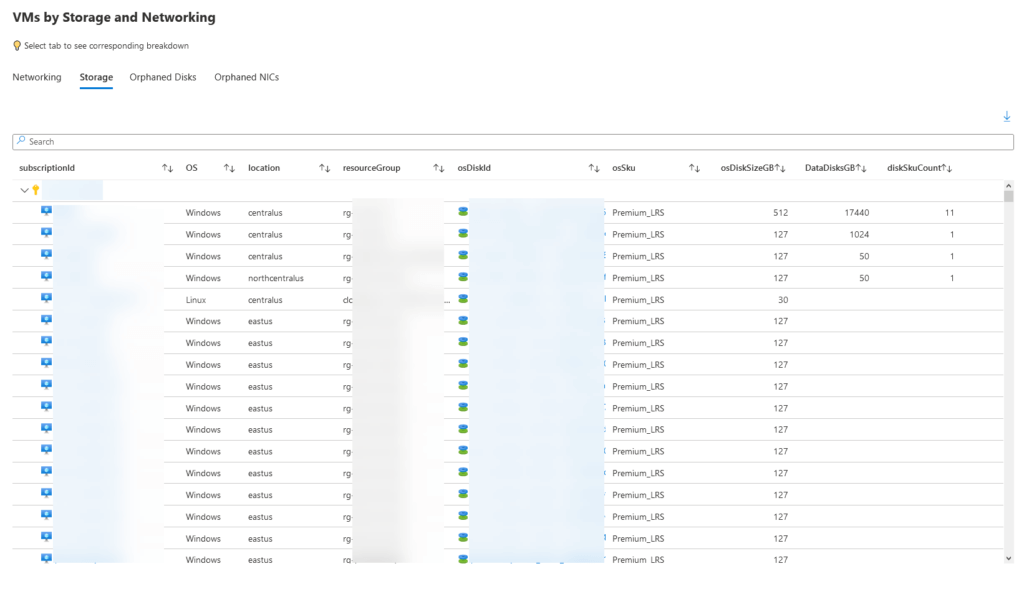
Because we can only do 3 joins in Azure Resource Graph, there is a second tab for Storage details of VMs. This gives a breakdown of OS Type, OS disk Size and then a summary of Data Disk Size and count.
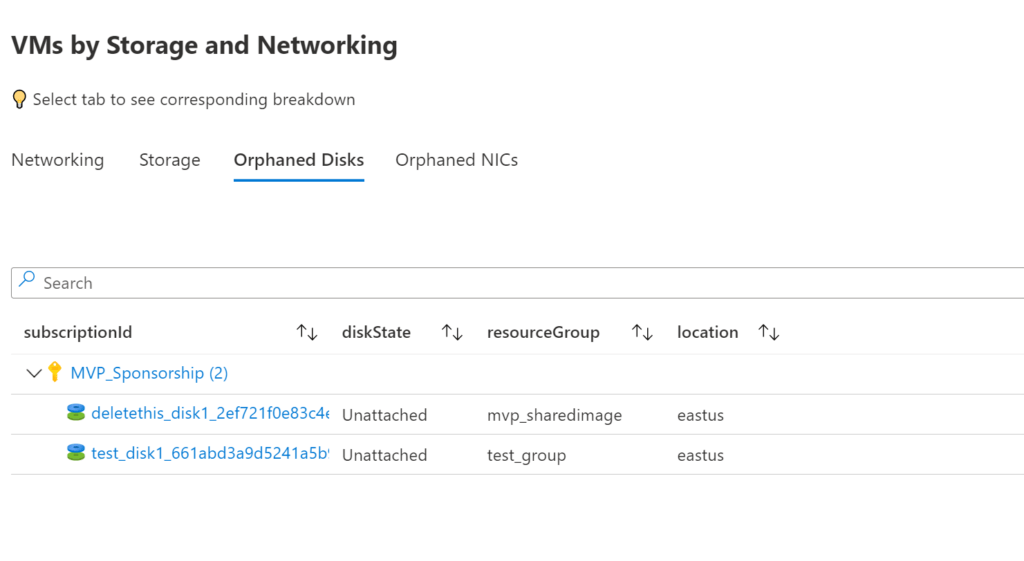
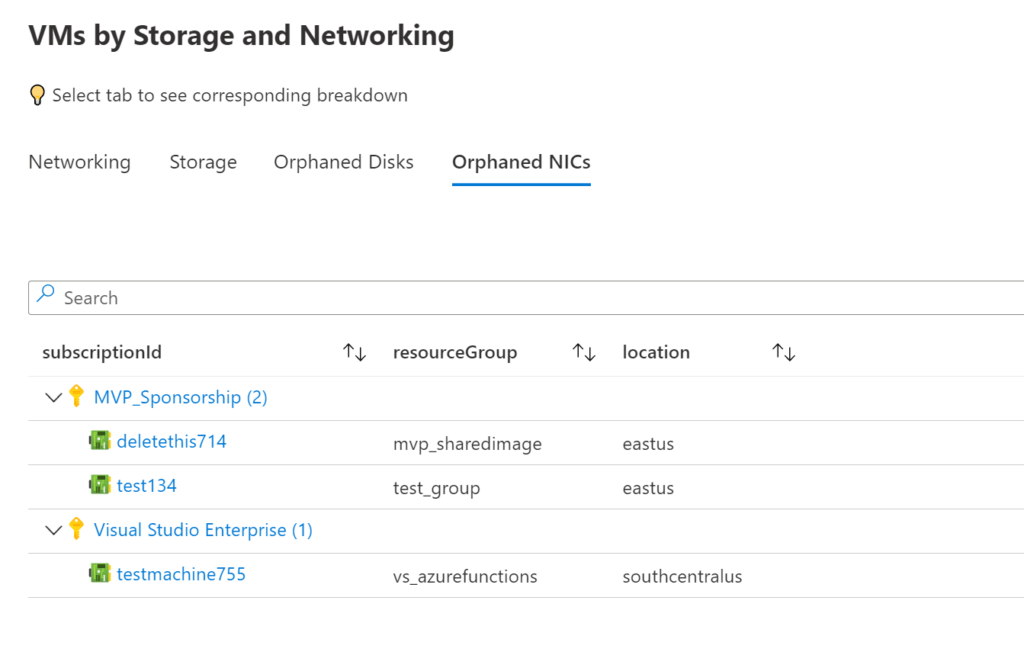
Orphaned Compute Resources
Additionally, we have Orphaned Disks and NICs. You still get charged for these resources, even if you have deleted the VM so it is a good practice to get rid of them.
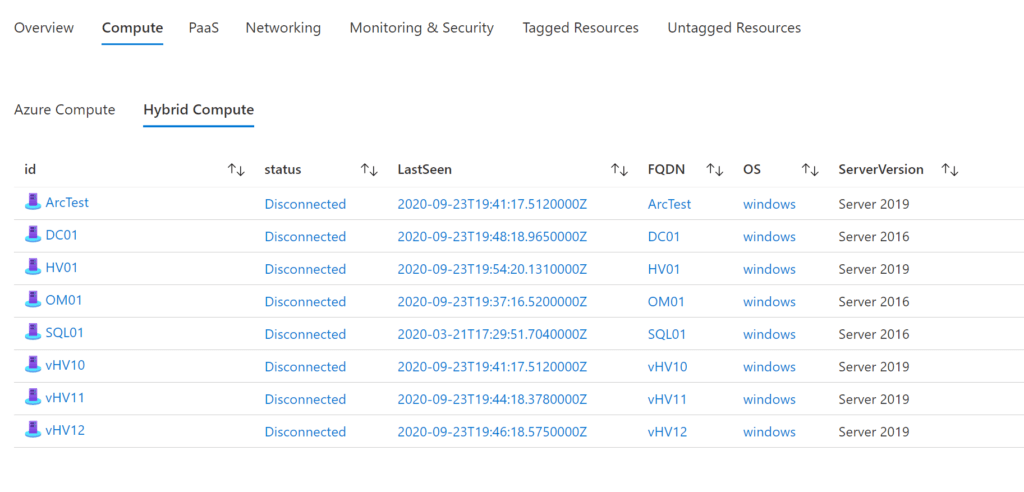
ARC Machines
Finally, we have ARC Machines as pulled in from Azure Resource Graph data.
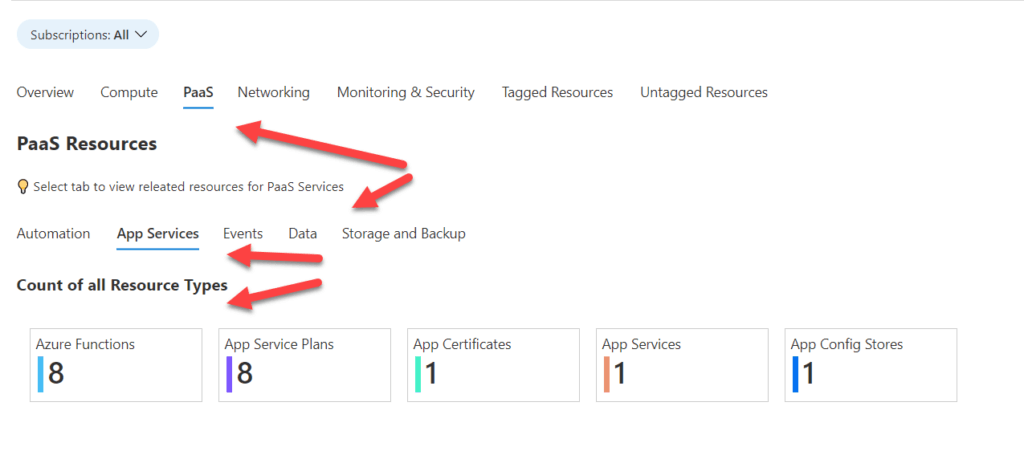
PaaS Resources
As noted above one of the struggles when creating this Azure Inventory Dashboard was where to place resources. The solution I landed on was having an entire tab for PaaS resources, with sub tabs under each. And then starting the summary below that.
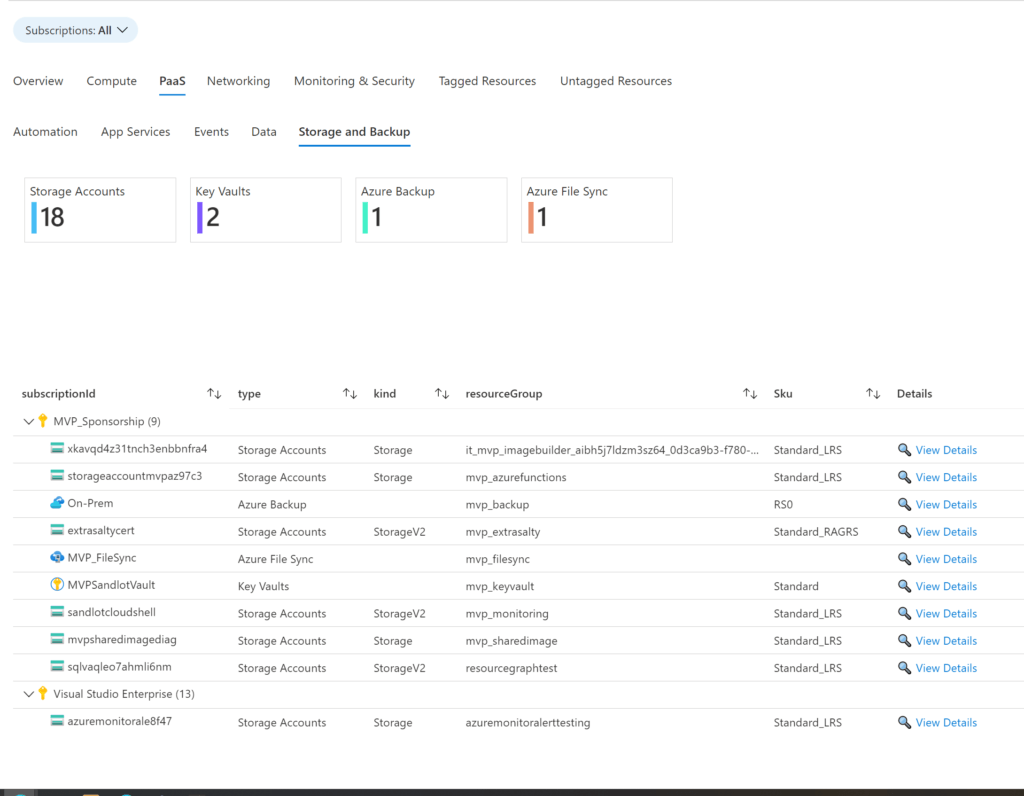
Storage & Backup
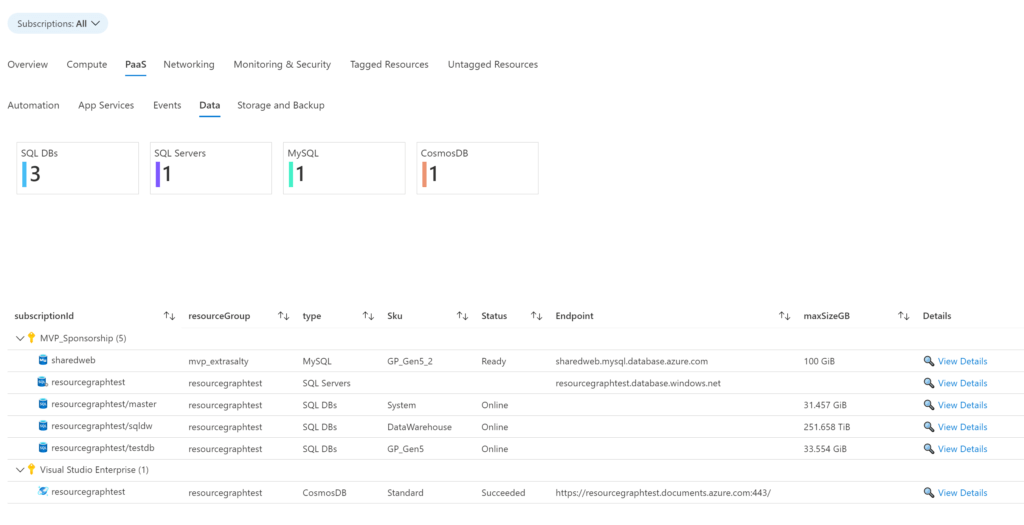
Data
App Services
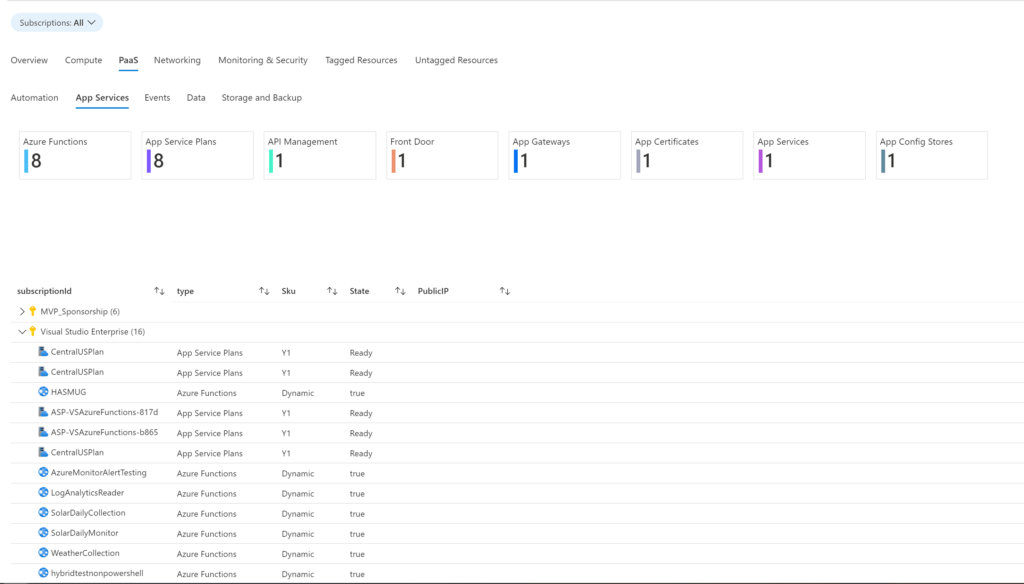
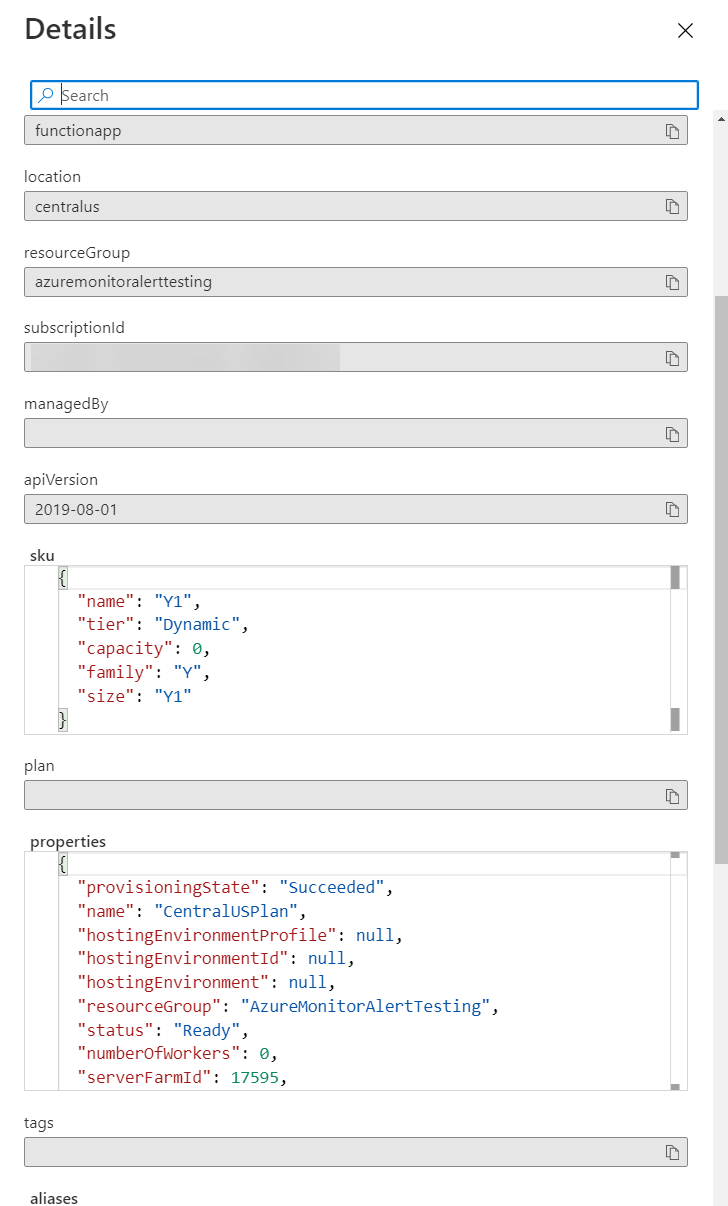
Additionally all detailed views have “View Details” pane which keeps intact all fields from Azure Resource Graph.
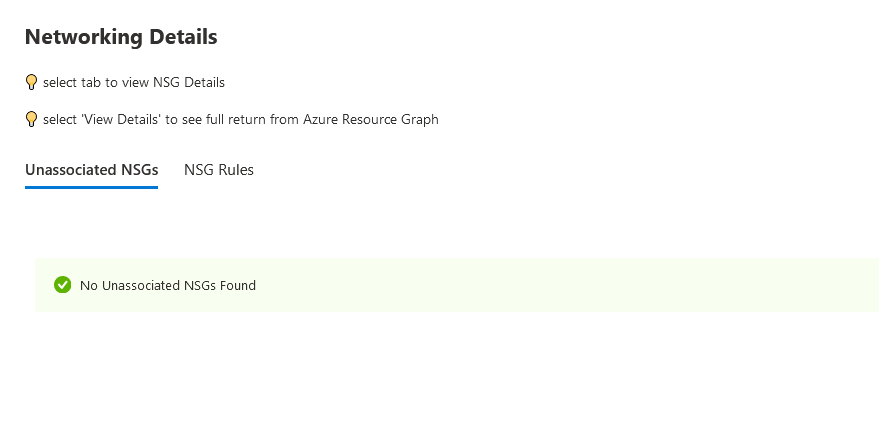
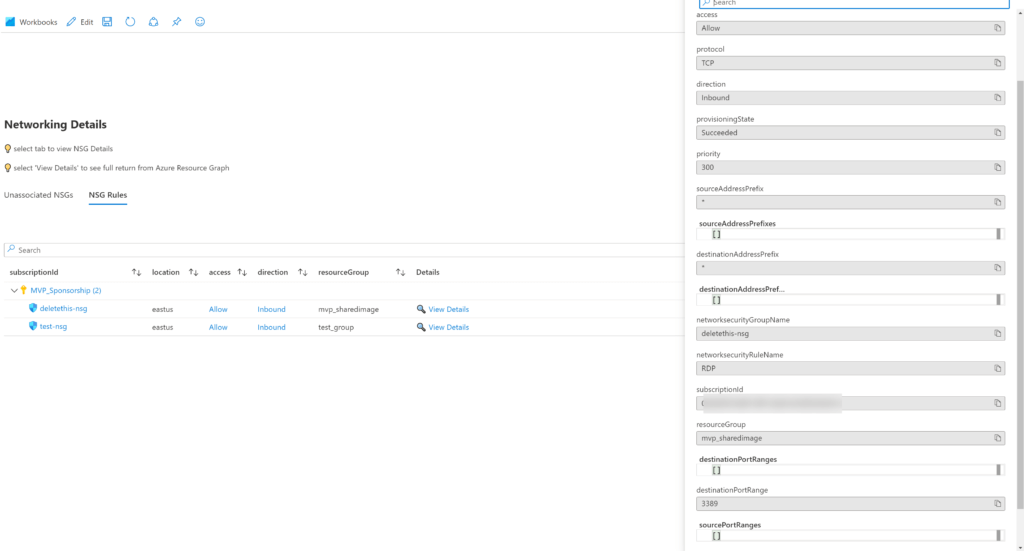
Networking
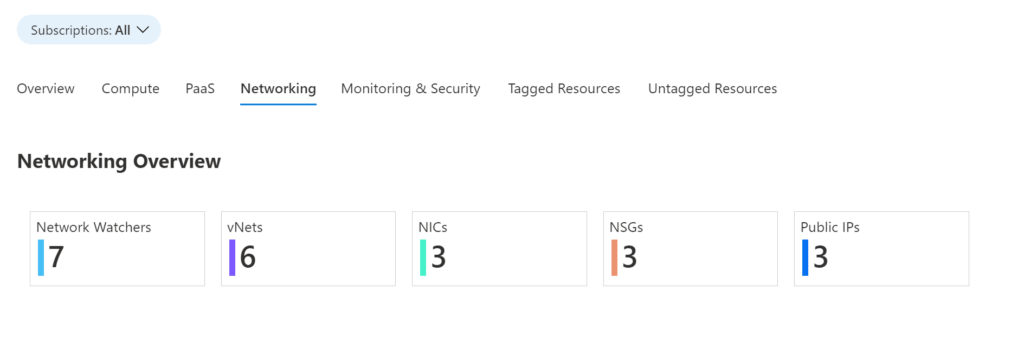
After the breakdown by network resource type, there are two tabs for NSGs one for finding unassociated NSGs and then the other that shows NSG rules with all its details.
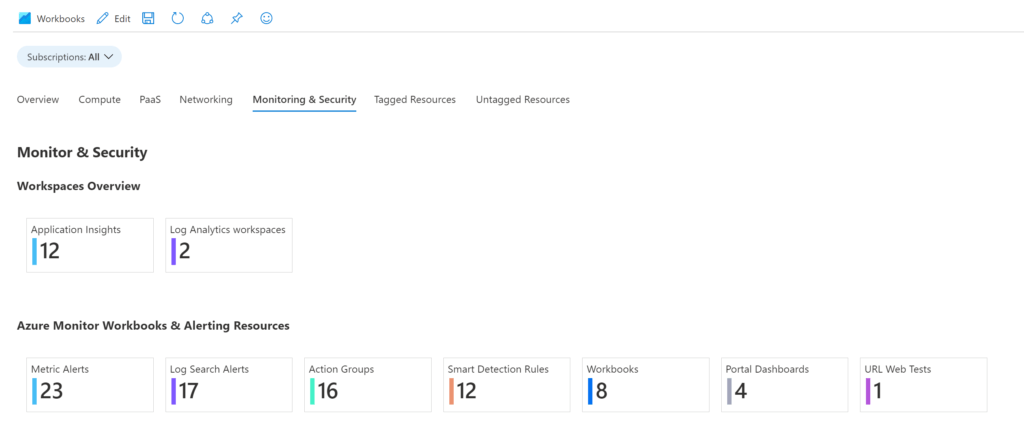
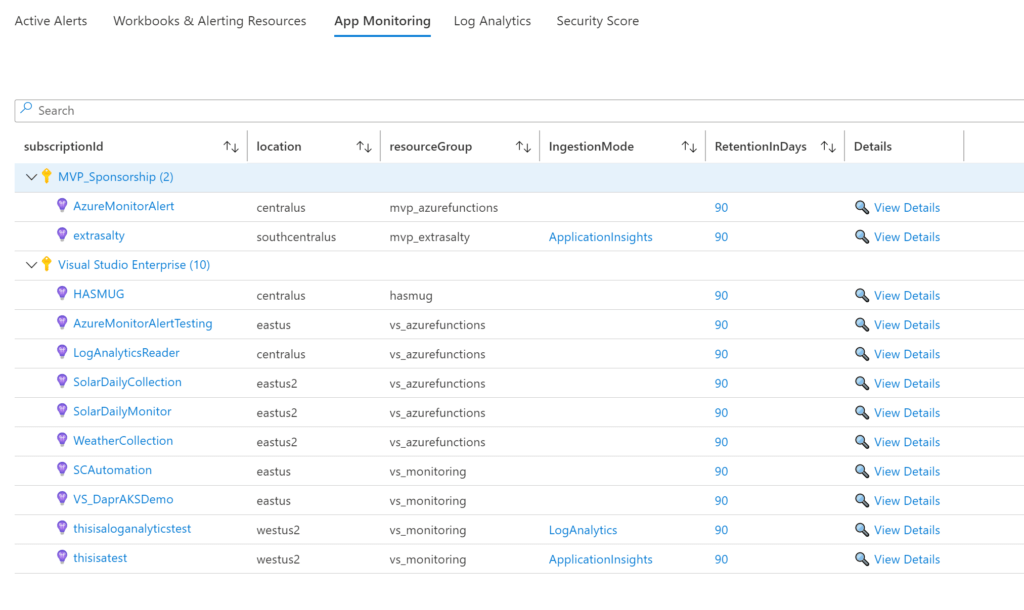
Monitor & Security
Monitor and Security is another interesting section I had to make choices on. For instance, looking at my initial screen grab, you may be asking well where’s Azure Sentinel?! Well, at present, there is no provider in Azure Resource Graph for Azure Sentinel, at least that I am aware of. To find Azure Sentinel, one needs to look through Solutions that are attached to Log Analytics workspaces. Which led to the creation of the Log Analytics with attached solutions section of the workbook as you’ll see down below.
At the top we have App Insights and Log Analytics count, followed by Alerts, Action Groups, Dashboards, Workbooks all by type.
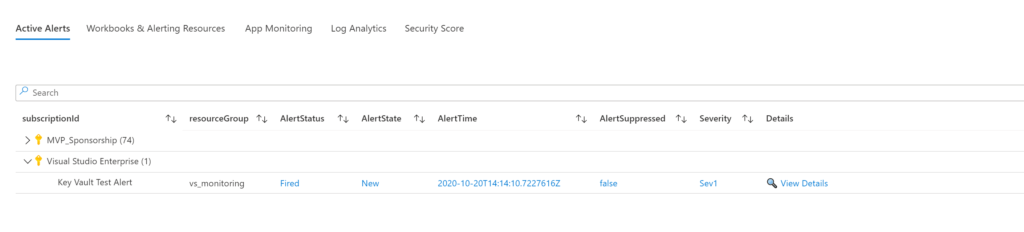
Followed by another set of tabs, where we have Active Alerts in Azure Monitor.
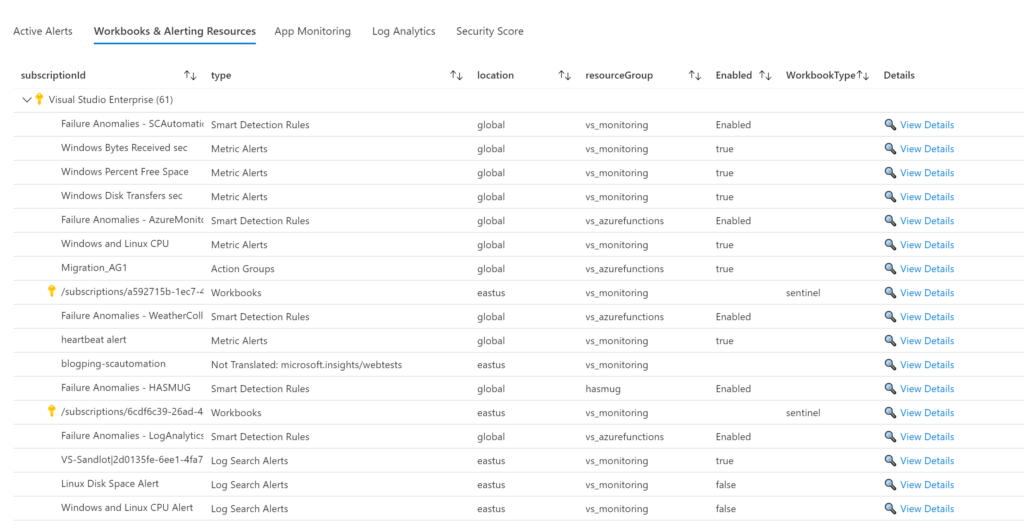
As well as a detailed view of Azure Monitor related resources.
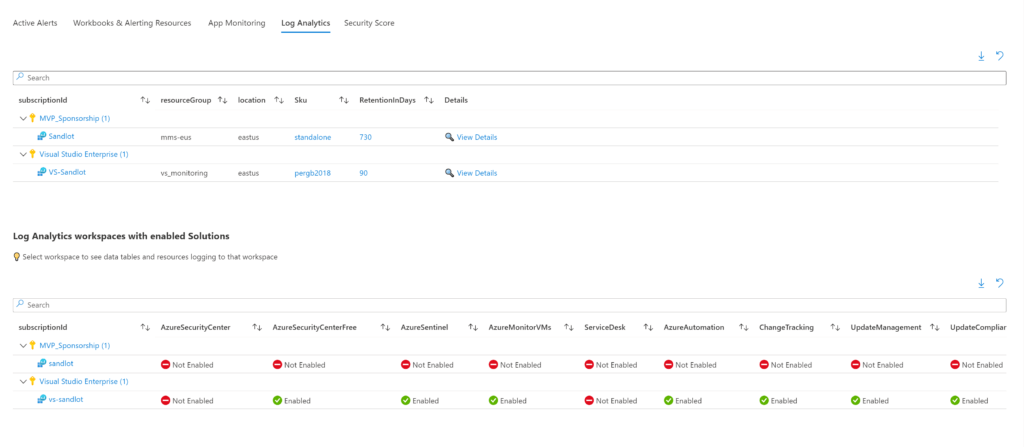
Our App Insights workspaces. Unfortunately, I could not find a way to link which applications were reporting to which App Insights at this time. Hopefully I can get that working in a future update.
Log Analytics by subscription with Sku and retention days. And as mentioned above, enabled solutions. This is not all of the enabled solutions, if there is one you are looking for, you can follow the pattern I have set out and add yours. But I believe I captured the main ones, including Azure Security Center and Sentinel. Also this section will likely change over time as I know the Azure Monitor Program Group is looking to change or remove Log Analytics solutions altogether.
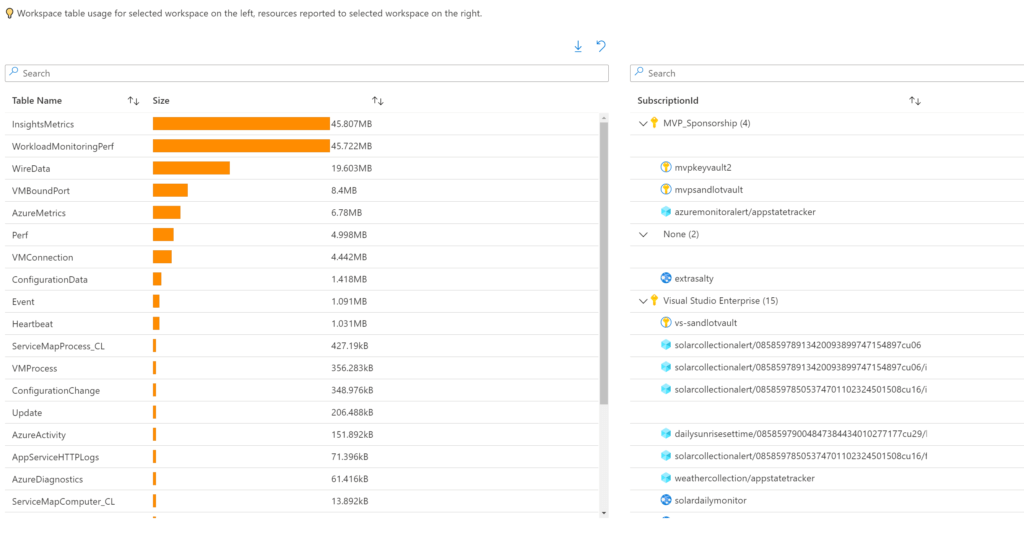
Finally if you select a workspace in the solutions pane, you’ll get the tables available in that workspace and how much they use and what resources are logging to that workspace. This is another section that needs some improvement, as apparently not all resources have subscriptions attached in to them in Log Analytics, which is how you get “none” in the subscription field.
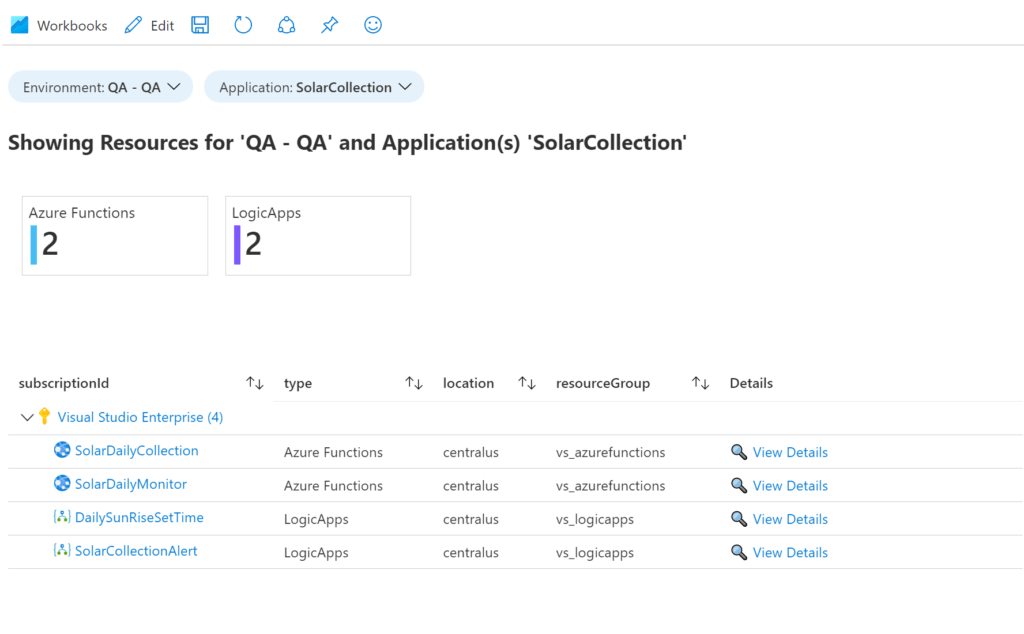
Tagged Resources
For tagged resources, I have included two parameters. Environment, and Application. In typical Azure environments the Environment tag is used to tag resources as Prod, Dev, QA, etc. You can see further example of how I use these tags in this post here. Depending on your tagging structure, you’ll need to edit these parameters and the subsequent queries.
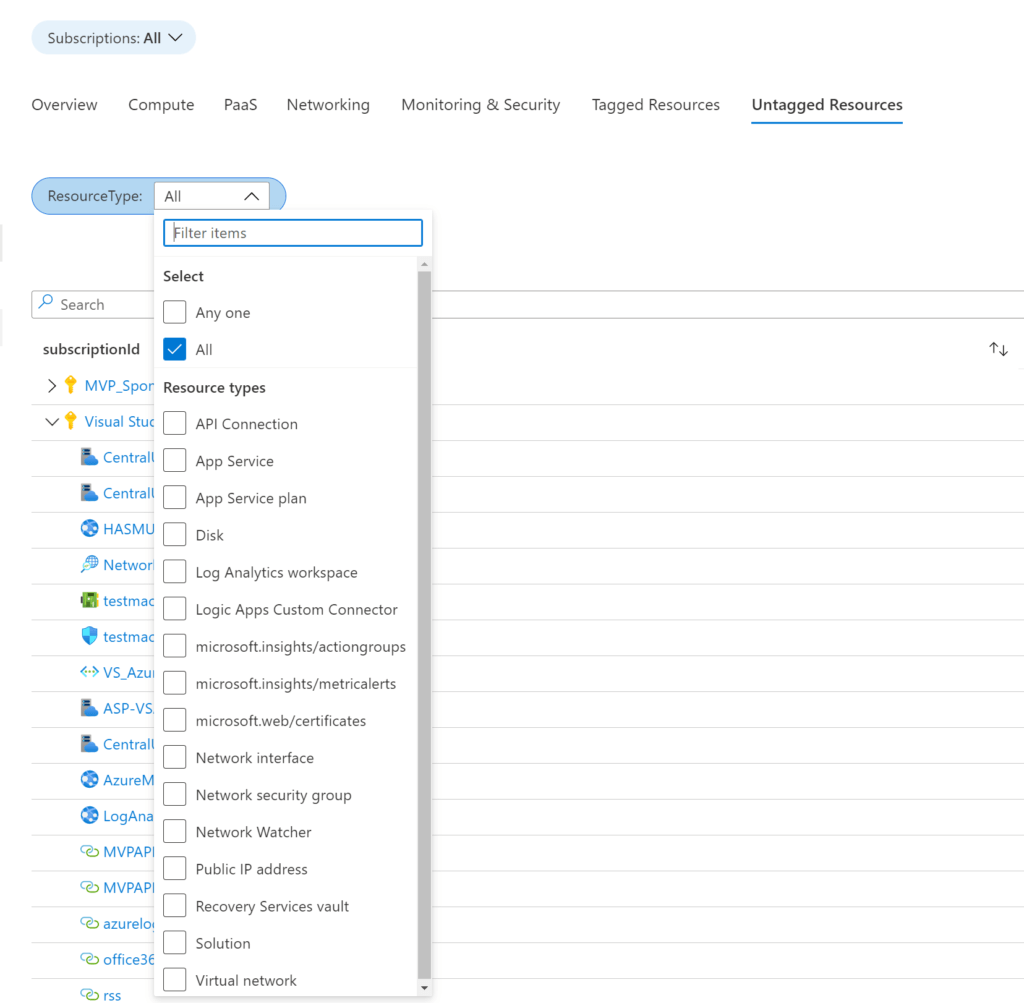
Untagged Resources
Finally, we have untagged resources section. This will show any resources where the tags field is empty. The parameter will allow you to search for any resource type that you want to see if they are tagged or not. Note, not all resources support tagging so it is likely this will never be empty.
Azure Inventory Dashboard
This workbook represents a very detailed view of any Azure environment, imo. Is it 100%? Absolutely not, as I don’t have access to all Azure resources to test with. Not to mention how long this has taken me as is, I wanted to get it out there so others can contribute. That is the beauty of open source and github, where I’ve placed this. If you find some of your resources aren’t collected by this workbook, please add them with a pull request and help me and your fellow community members out.
I will have a subsequent blog post on how to edit and design such workbooks.