
Underneath every Azure Monitor Alert is a Schema. I talked a little bit about the schemas here. For this post I’ll be talking about the Common Alert Schema. However, everything I show can still be done with the non common alert schema. In this post I’ll show you how to examine the Azure Monitor Alert Schema with Logic Apps. You might be thinking, if its “common alert schema” why would I need to examine it? You’ll see below, but in short, the schema changes based on what you alert on and the dimensions chosen.
Setup Logic App
Create your Logic App in your preferred method, ARM Template, portal, powershell. I’m not covering that piece because its very easy to create a blank one.
Once created, in the Designer there are a bunch of templates. Notice, you’ll see one called Azure Monitor – Metrics Alert Handler, as well as the HTTP Trigger.
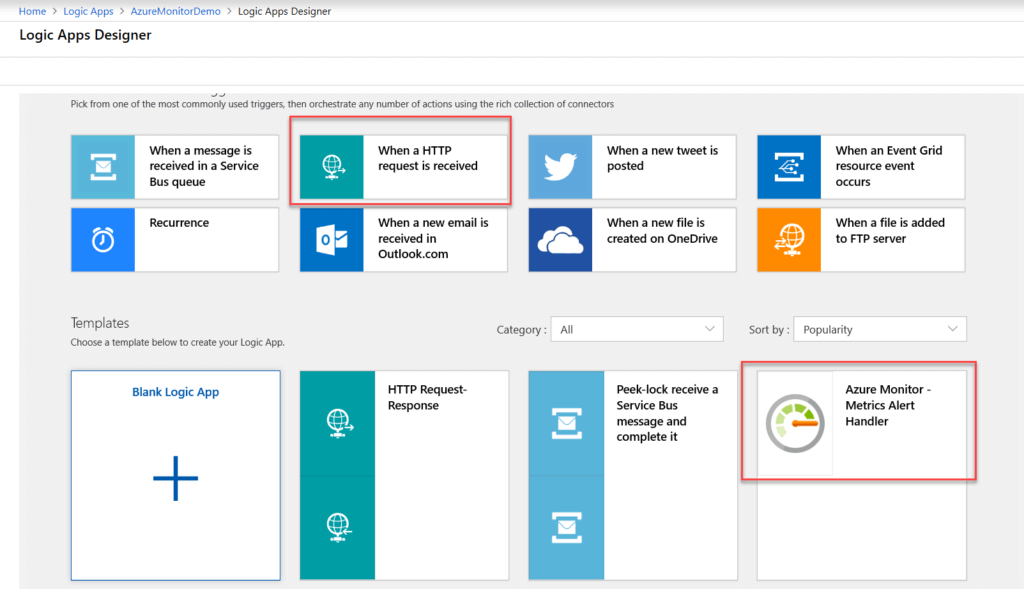
I selected the Metrics Alert Handler to show that its exactly the same as the HTTP Trigger, except that it comes with the Common Alert Schema for Metric alerts already in the Request Body JSON Schema, as seen below.
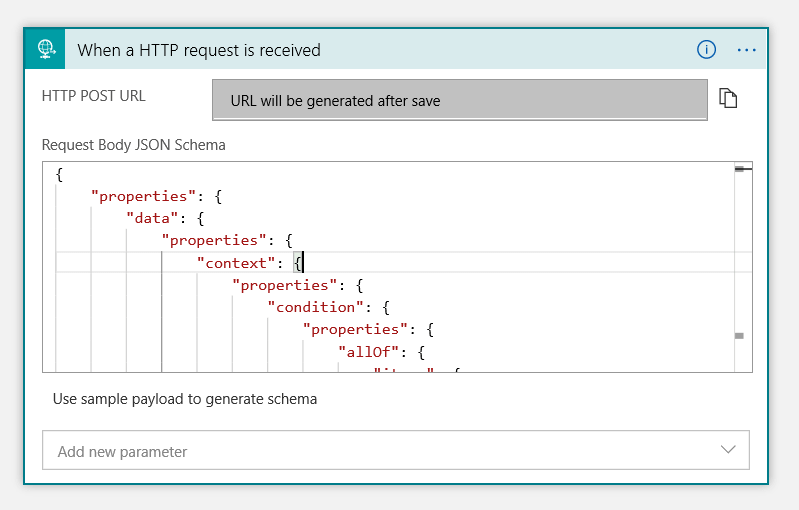
It doesn’t really matter which one you select because you can change the schema by using the sample playload to generate schema. Which I’ll show after we setup the Action Group for the Logic App.
Setup Action Group
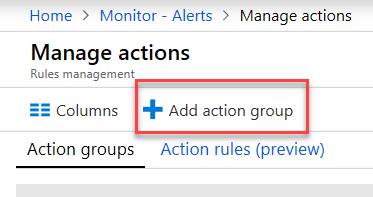
For any Azure Monitor alert, you need an Action Group to send the alert to. One of the options is Logic Apps. Under Azure Monitor click on Alerts then select Add Action Group.
The Add Action group window will open. Give your Action Group a Name, short name, select subscription, Resource Group. 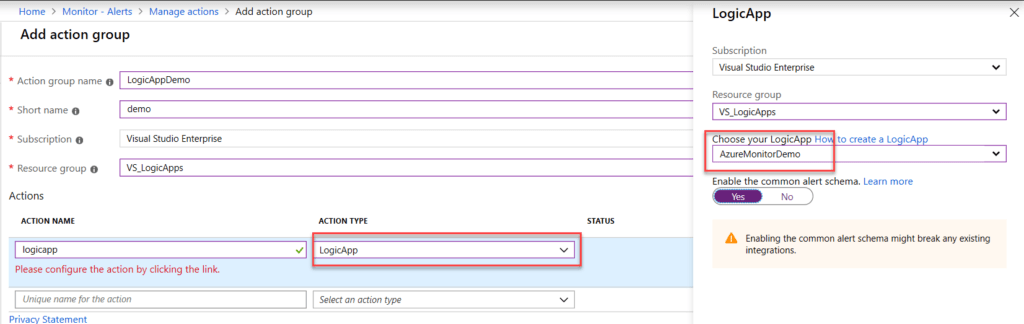 Then under Action Name give it a Name, select LogicApp for Action Type. In the right hand blade select the Resource Group that your Logic App is in, and select your Logic App. Select “Enable the common alert schema”
Save and close.
Now add the Action Group to your Alert Rule.
Review Alert Schema
To review the schema of your particular alert you can open your Logic App and look at the Overview page. At the bottom you have Runs History, and this is the best part of Logic Apps for Azure Monitor Alerts.
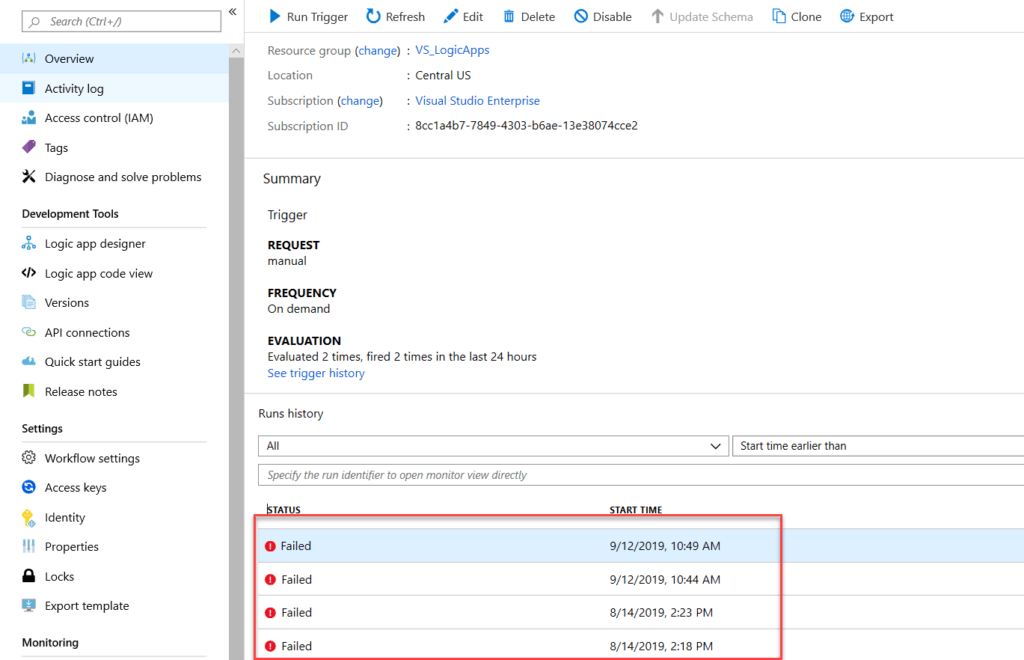
Click on any one and the Runs History page will open where you can review the exact JSON payload that was sent to the Logic App. By expanding the HTTP Trigger action and then clicking on “Show Raw Outputs.”
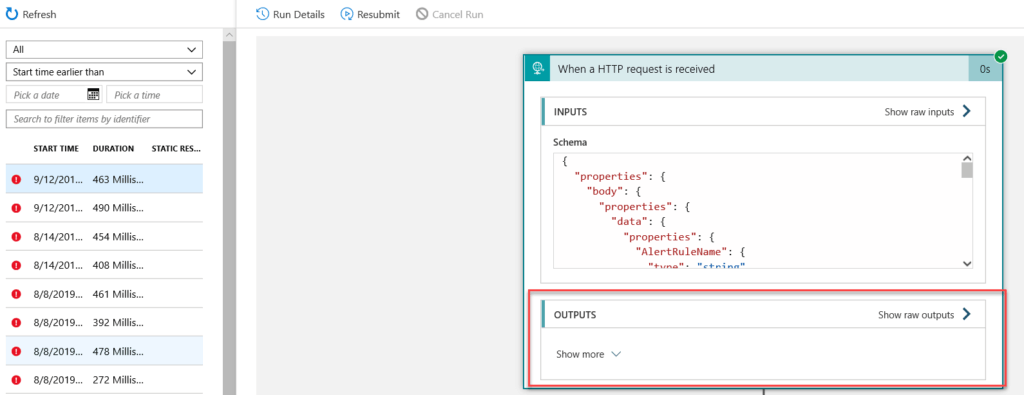
In the raw outputs pane is the full JSON payload. Nothing about the Headers or Body up to alertContext changes with the types of alerts. Again this is the Common Alert Schema.
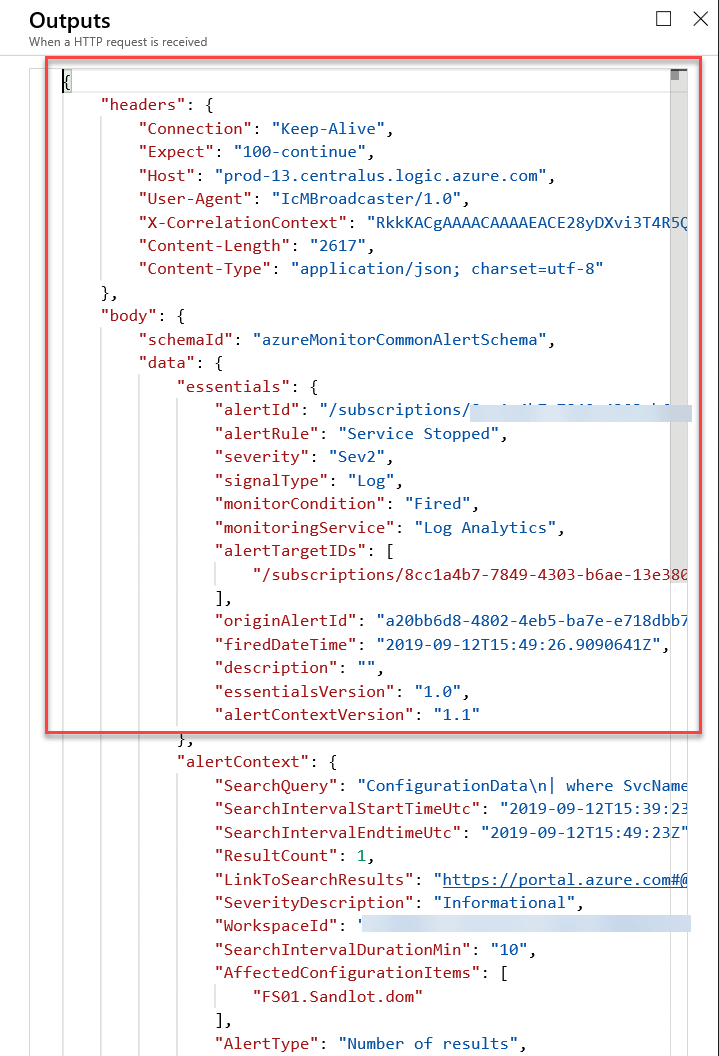
What does change is under alertContext. Below is a Metric based alert for % Processor Time. You can see the difference from the above screen grab, which was from a Log Search alert. That alert has the Search Query that triggered the alert, workspaceId how many times it was triggered.
Versus the below metric alert, doesn’t have any of that information and its all about the metrics.
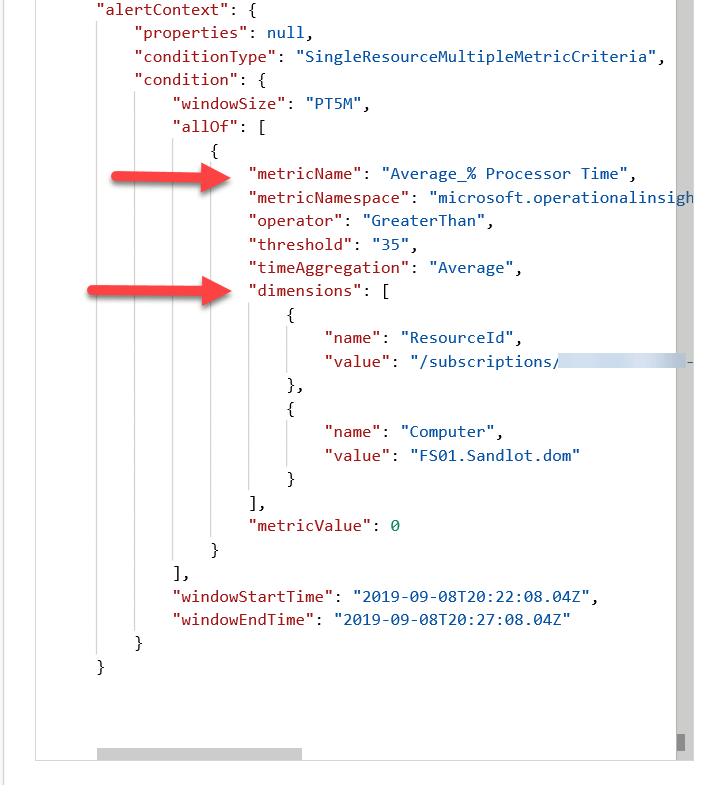
The key with Metric alerts is getting the metric name, threshold and dimensions, this is where the resource name will be.
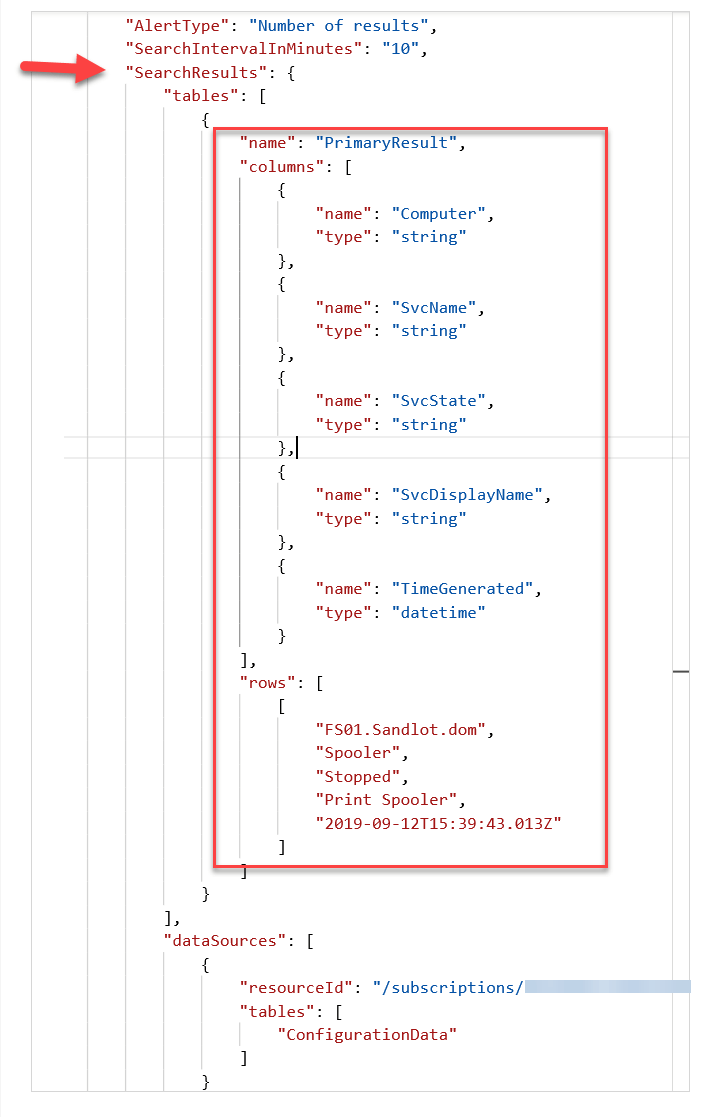
The key with Log Search alerts, is Tables under Search Results. This is where you’ll see Columns and Rows. Columns always contains the field name and type, rows always contains the actual field values. This is why I say to use project on log search alerts to limit them to only the pertinent information. This will change drastically for every different type of alert that you create with Log Search.
Use Sample Payload in Logic Apps
Now you’ve seen how the Common Alert Schema will change. To import different types schemas for various types of alerts, you can once again go to the run history page on a Logic App that has been fired by an alert.
In the outputs pane copy the entire schema then navigate back to visual Logic App designer. Select “use sample payload to generate schema.”
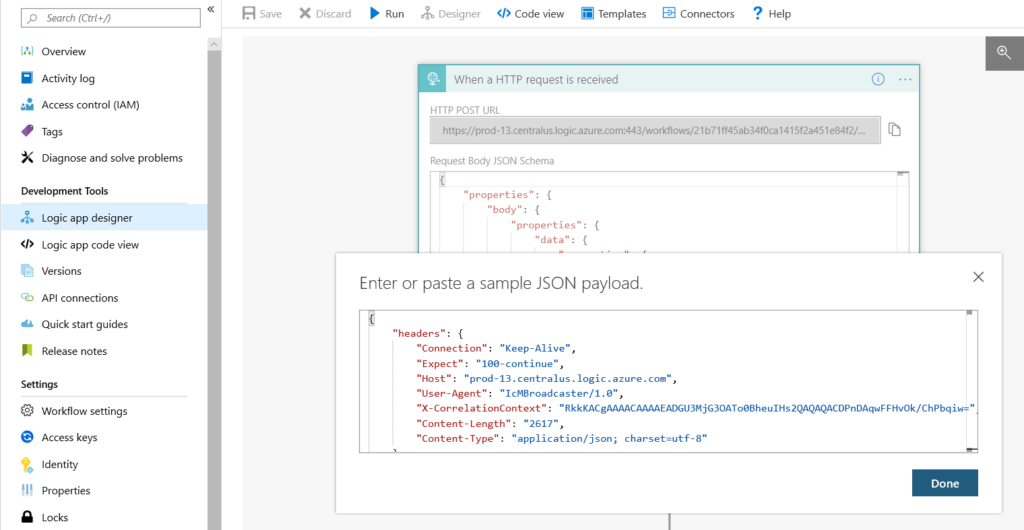
In the window, paste the JSON payload.
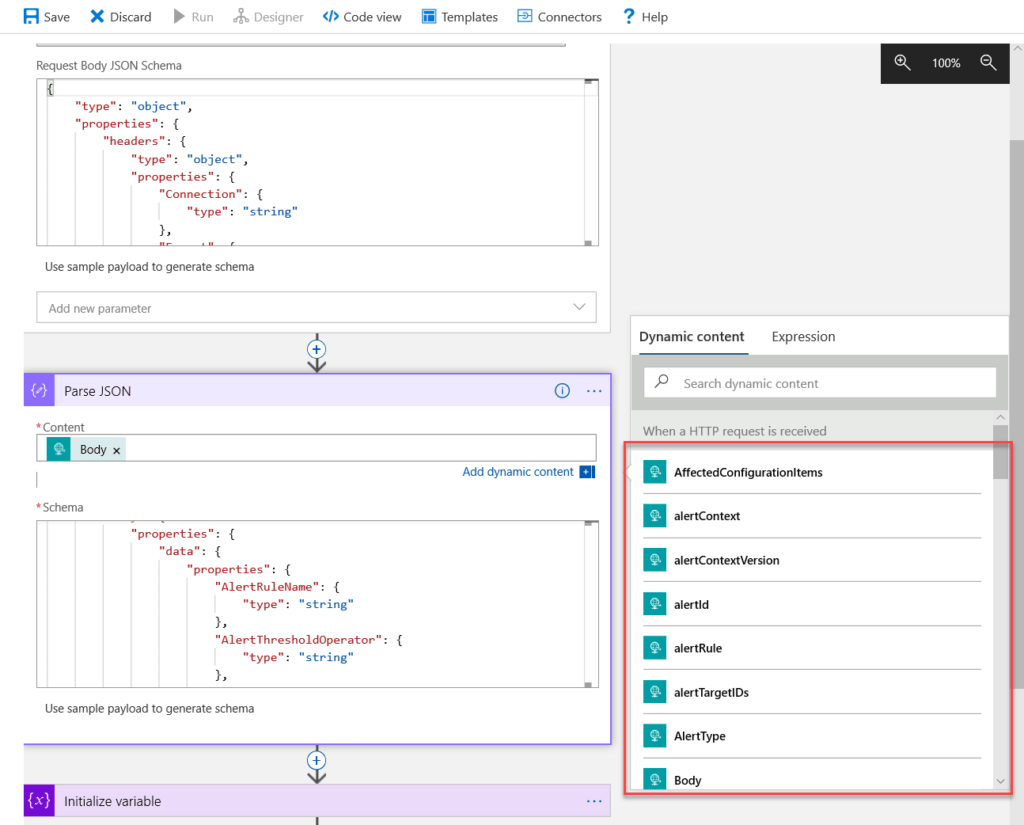
Now, in later actions you have available fields from the schema.
Unfortunately I have found that you have to have some additional steps to extract all pertinent information from the alert. In a future post I will have a full template for Logic Apps handling Azure Monitor Alerts.
Schema Repo
I have created a repo here that has both of the JSON payloads for the alerts in this post.
1 thought on “Use Logic Apps to examine Azure Monitor Alert Schema”
Comments are closed.