Today I’ve got another Azure Monitor Workbook, this time for Windows Virtual Desktop (WVD). This workbook uses exclusively Log Analytics data IaaS data, so it will work with both WVD 1.0 and 2.0. Though there are some nice logs available in the diagnostic settings for WVD 2.0.
If this is your first time on my blog, I have a bunch of other workbooks you may also be interested in, as well.
Workbooks
- Ultimate Azure Inventory
- Azure SQL
- LogicApps/Azure Sentinel Playbooks
- Azure Automation Update Management
- Azure File Sync
- Syslog
- Windows Event Log
- QuickStart Templates
- Azure Automation Change Tracking Workbook
You can find them all on my github and the Azure Monitor community github.
WVD Workbook Github here
Requirements
As noted above this WVD Azure Monitor Workbook is using exclusively IaaS perf and logging data.
You’ll need:
- Log Analytics workspace
- Perf Data
- RemoteFX Graphics(*)\Frames Skipped/Second – Insufficient Server Resources
- RemoteFX Network(*)\Current TCP RTT
- RemoteFX Network(*)\Current UDP RTT
- Terminal Services(*)\Active Sessions
- Terminal Services(*)\Total Sessions
- Azure Monitor for VMs*
- Logs
- FSLogix-Apps/Operational**
- Azure Security Center**
- System
-
Microsoft-Windows-RemoteDesktopServices-SessionServices/Operational
- Perf Data
- WVD Machines reporting to workspace
* Azure Monitor for VMs, I am using the Perf data from InsightsMetrics table as I did not want to double bill the client for these metrics. If you are not using Azure Monitor for VMs you can easily add the same counters I’m using in those queries to your workspace and then modify the queries as needed.
** Azure Security Center and FSLogix, this is for the profile load times tab, if you do not want this information or don’t have Azure Security Center, it can be removed.
Additionally, if you have other machines reporting to the workspace that aren’t part of you’re WVD environment, you’ll want to add a filter likely by ResourceGroup in the queries, as all of these queries will bring in machines that aren’t related to WVD.
WVD Azure Monitor Workbook
I’ve broken the workbook out into Server Perf and User Perf, using metrics that give an idea of user experience while using WVD.
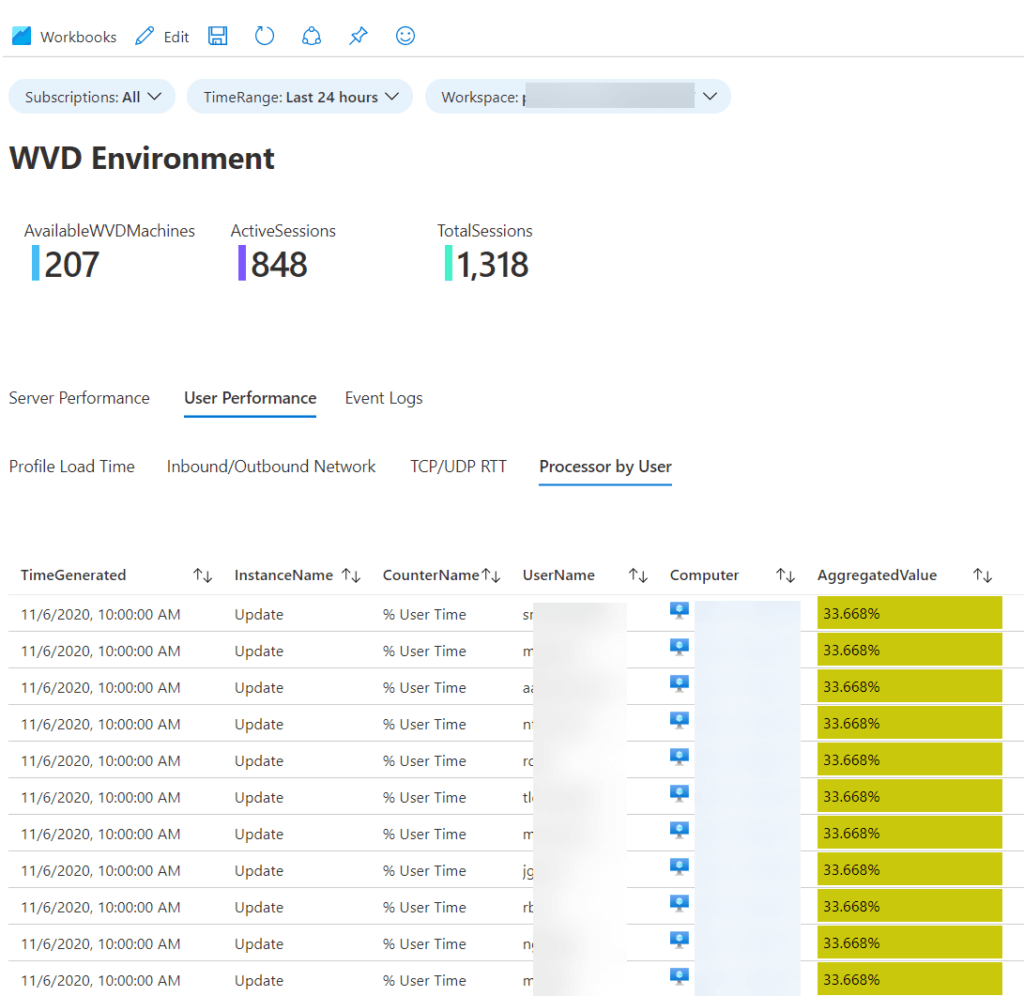
At the top is available machines, active sessions and total sessions. This is the only information that does not obey the time range parameter. It will always give you the latest data available.
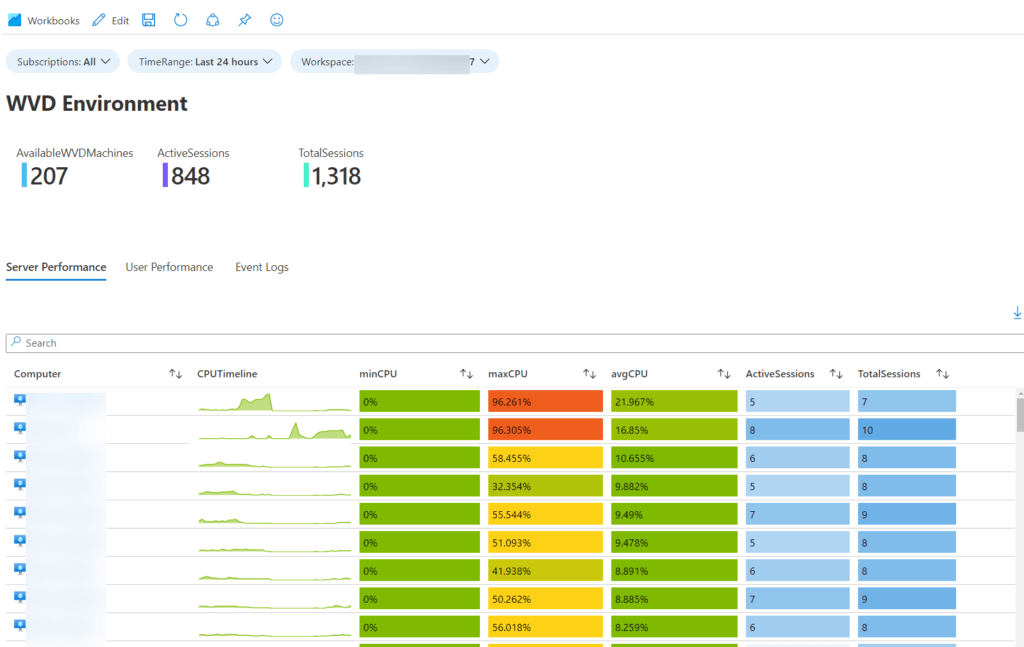
Server Performance
Server perf gives you CPU timeline, average, min and max with Active and Total sessions on each server.
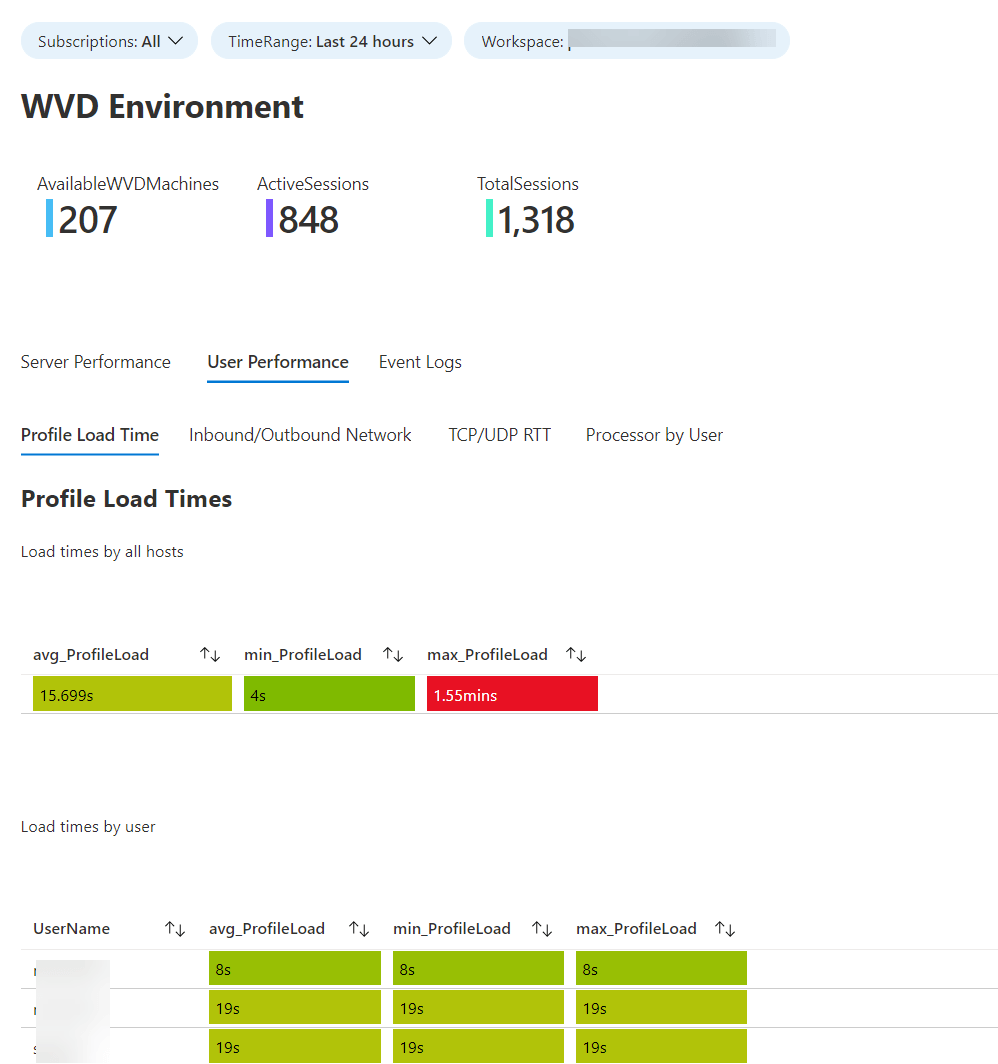
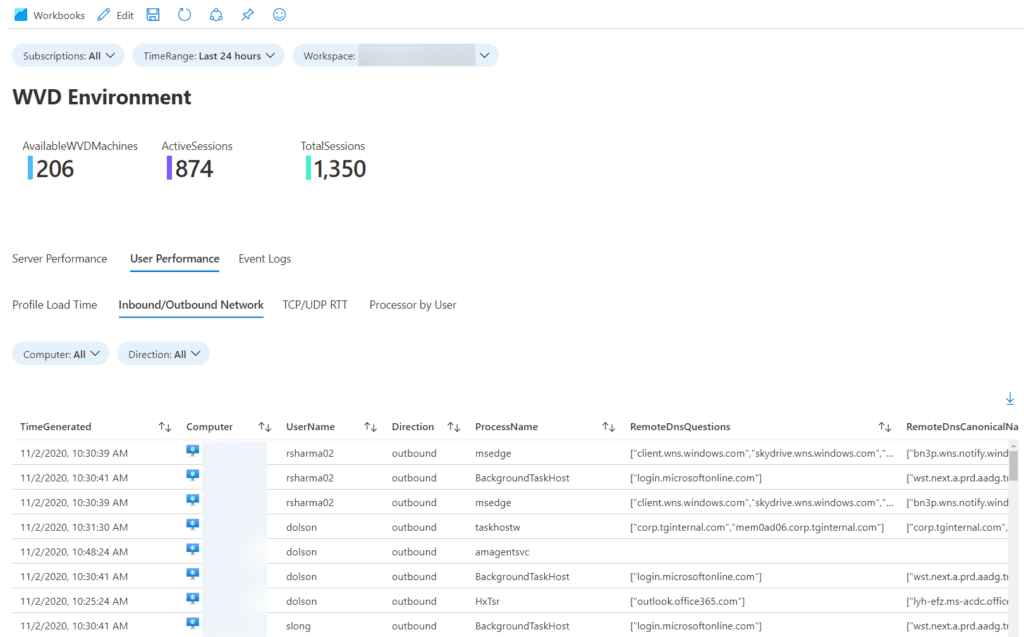
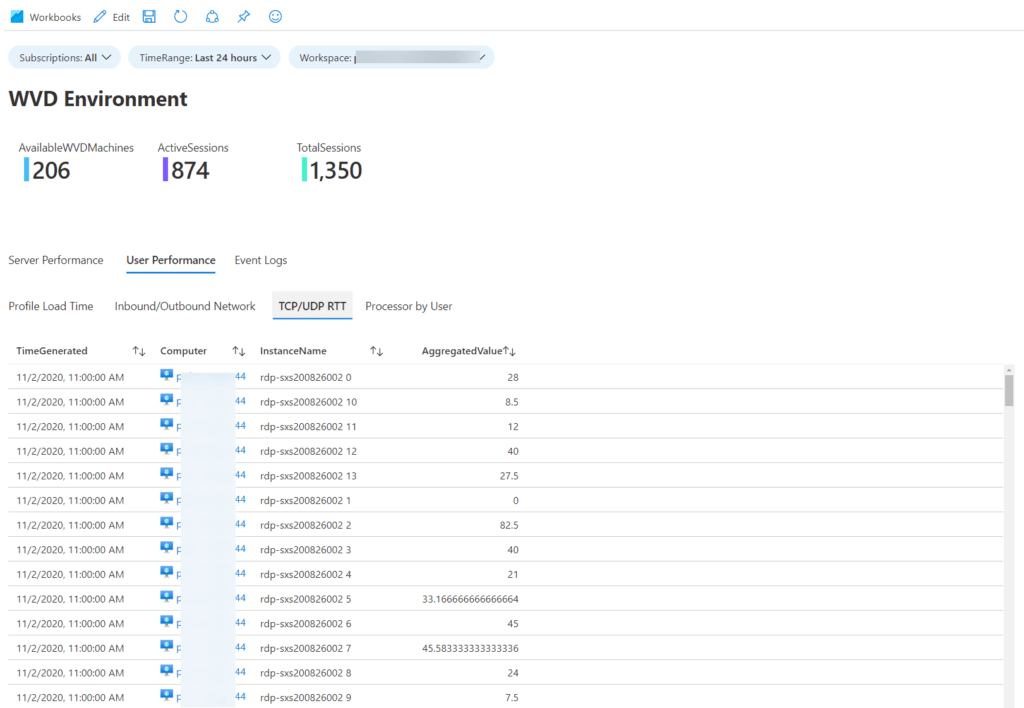
User Performance
Under user perf, I have the profile load time, which is also the only queries I claim, so if they suck thats my fault. This tab gives you profile load time across all host and then by user. If you want to do per host or see the queries you can check my blog post here.
The rest of these queries are borrowed with pride from the Azure Monitor for VMs workbooks. Again if you’re not using Azure Monitor for VMs you’ll need to adjust the Perf counters and queries accordingly.
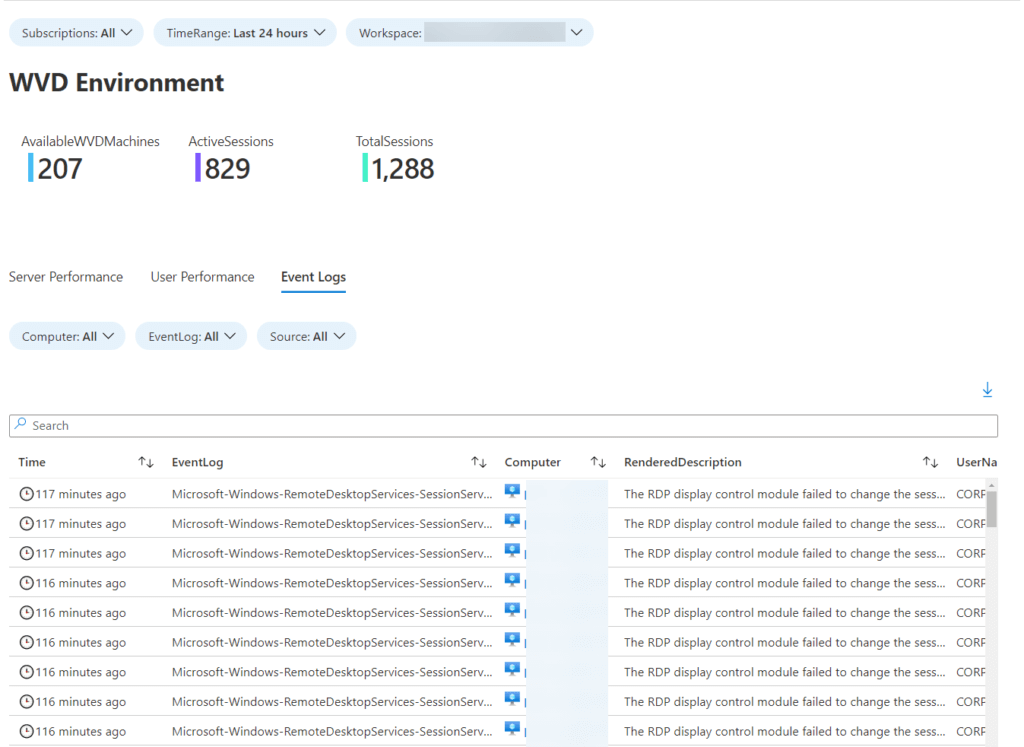
The Event logs section is a filtered down section of my Event Logs workbook that has the RDS log as the main log being displayed.