The Heartbeat table in Log Analytics is surprisingly useful for a number of things. First at its base level, it acts as an inventory of your VMs. The table contains a number of useful columns from Solutions a VM is scoped to, Os Type and versions to what resource group they are in. In this post I’ll take you through a number of the ways the Heartbeat table can be used and show you the new way to setup Heartbeat alerts.
Heartbeat Table as Inventory
Right off the bat, the Heartbeat table provides useful information. It provides Computer FQDN, Agent type, OSType, OS Version for Major and Minor, Subscription, ResourceGroup, ResourceProvider, ResourceId, ResourceType, ComputerEnvironment, Solutions, and TenantId. In addition to the projected-away fields.
Inventory of Solutions
Because you can target solutions, you may need to find out which computers are scoped to which solutions. The Solutions column in the heartbeat table contains a comma separated value list of all the Solutions that computer is scoped to.
This is a very easy query to find out which Computers are scoped to Updates Management solution. Known in the Solutions column as “updates.”
Heartbeat
| where Solutions has "updates"
| distinct Computer
We can then join the Heartbeat table with… the Heartbeat table. This isn’t fully thought out but it gets the point across.
Heartbeat
| distinct Computer
| join kind= leftouter (Heartbeat
    | where Solutions has "updates"
    | distinct Computer
    | extend Updates = True) on Computer
Tracking Software and Services
Because Change Tracking is the easiest solution to scope, a situation may arise where you need to find out if a service is running or if certain software is installed on all machines connected to Log Analytics.
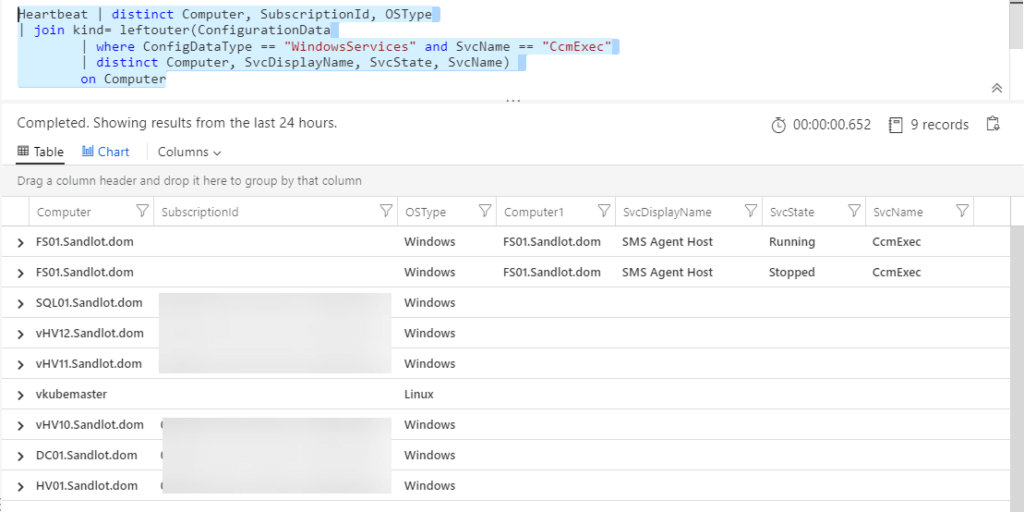
First, lets track which machines have CCMExec Service running. We’ll use the Heartbeat table to get distinct Computers and join with ConfigurationData.
Heartbeat | distinct Computer, SubscriptionId, OSType
| join kind= leftouter(ConfigurationData
| where ConfigDataType == "WindowsServices" and SvcName == "CcmExec"
| distinct Computer, SvcDisplayName, SvcState, SvcName)
on Computer
Once you have the data together, we can create summaries. This query creates a pie chart.
Heartbeat | distinct Computer, SubscriptionId, OSType
| join kind= leftouter(ConfigurationData
        | where ConfigDataType == "WindowsServices" and SvcName == "CcmExec"
        | distinct Computer, SvcDisplayName, SvcState, SvcName)
        on Computer
| project-away Computer1
| extend CcmExec = SvcState == "Running"
| summarize dcount(Computer) by CcmExec
| extend CcmExec=replace(@"True",@"Service Running", tostring(CcmExec))
| extend CcmExec=replace(@"False",@"Not Running", CcmExec)
| render piechart title="CcmExec Status"
and this one outputs a grid view of exact machines and their service status.
Heartbeat | distinct Computer, SubscriptionId, OSType
| join kind= leftouter(ConfigurationData
        | where ConfigDataType == "WindowsServices" and SvcName == "CcmExec"
        | distinct Computer, SvcDisplayName, SvcState, SvcName)
        on Computer
| project-away Computer1
| where OSType == "Windows"
| extend CcmExec = SvcState == "Running"
| distinct Computer, SvcName, CcmExec, OSType, SubscriptionId
| extend CcmExec=replace(@"True",@"Service Running", tostring(CcmExec))
| extend CcmExec=replace(@"False",@"Not Running", CcmExec)
| project-away SvcName
| sort by CcmExec asc
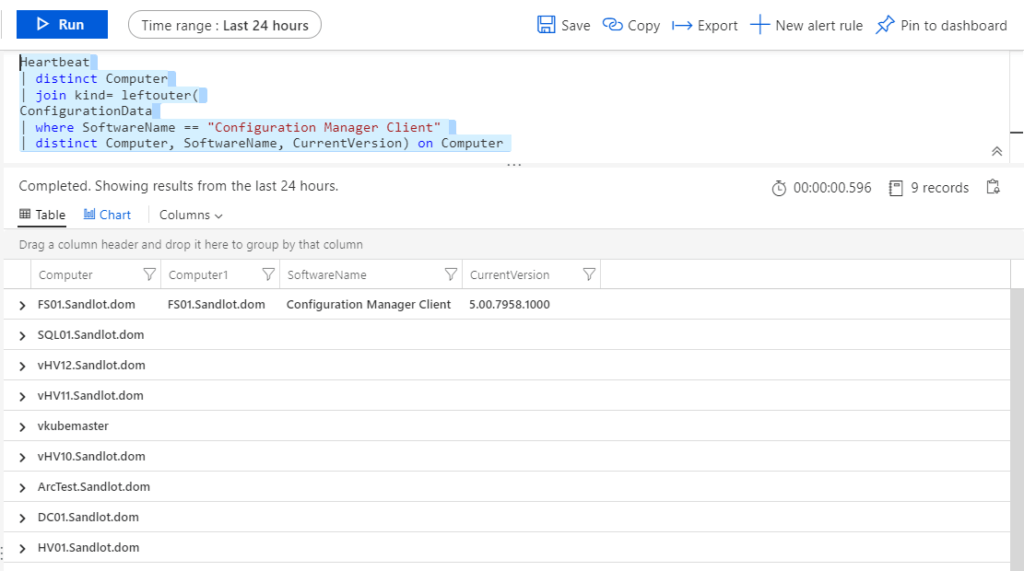
Picking on Configuration Manager again, we can check inventory of software against the heartbeat table. Using the ConfigurationData table we can track any software installed on our servers.
Heartbeat
| distinct Computer
| join kind= leftouter(
ConfigurationData
| where SoftwareName == "Configuration Manager Client"
| distinct Computer, SoftwareName, CurrentVersion) on Computer
Heartbeat Metric Alert
These examples only work if you’re using Log Analytics, but what about machines that are using Log Analytics but go offline for some reason. If you’ve searched in the last few years you may have run across something like this.
Heartbeat
| summarize max(TimeGenerated) by Computer
| where max_TimeGenerated > ago(5m)
At some point between when Heartbeat metrics went public preview and now, they opened the metric up, it can now be applied against a Log Analytics workspace, in addition to individual Azure VMs. You cannot apply Heartbeat to a resource group in a metric alert, like other metrics.
What this means for you, is that, of course you can still use the Log Search method to generate heartbeat alerts. You can now create a Metric Alert against production workspaces so that any new VM that gets added will automatically be monitored. Metrics are faster than log ingestion. Also Azure Monitor remembers the state of Metric Alerts, as opposed to log search alerts.
Enable with Powershell
There are a number of examples of how to create Metric alerts via the Azure Portal. Therefore this is how to do it with the Azure Monitor Powershell commands.
$workspace = get-azoperationalinsightsworkspace -ResourceGroupName $RG -Name vs-sandlot

$dim = New-AzMetricAlertRuleV2DimensionSelection -DimensionName "Computer" -ValuesToInclude "*"

$criteria = New-AzMetricAlertRuleV2Criteria -MetricName "Heartbeat" `
-DimensionSelection $dim `
-TimeAggregation Total `
-Operator LessThan `
-threshold 3 `

Add-AzMetricAlertRuleV2 -Name "Heartbeat Alert" `
-ResourceGroupName $workspace.resourcegroupname `
-WindowSize 00:05:00 `
-Frequency 00:01:00 `
-TargetResourceId `
$workspace.ResourceId `
-Condition $criteria `
-ActionGroup $action `
-Severity 3 `
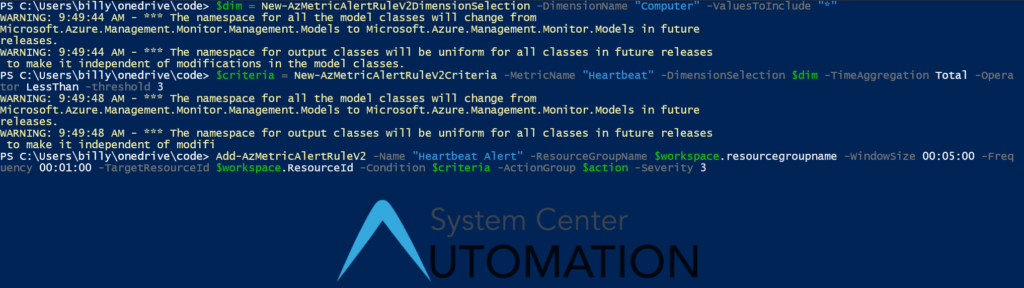
This example gets the Log Analytics workspace, sets the Dimensions to include, sets the Alert criteria and then creates the alert with Add-AzMetricAlertRuleV2
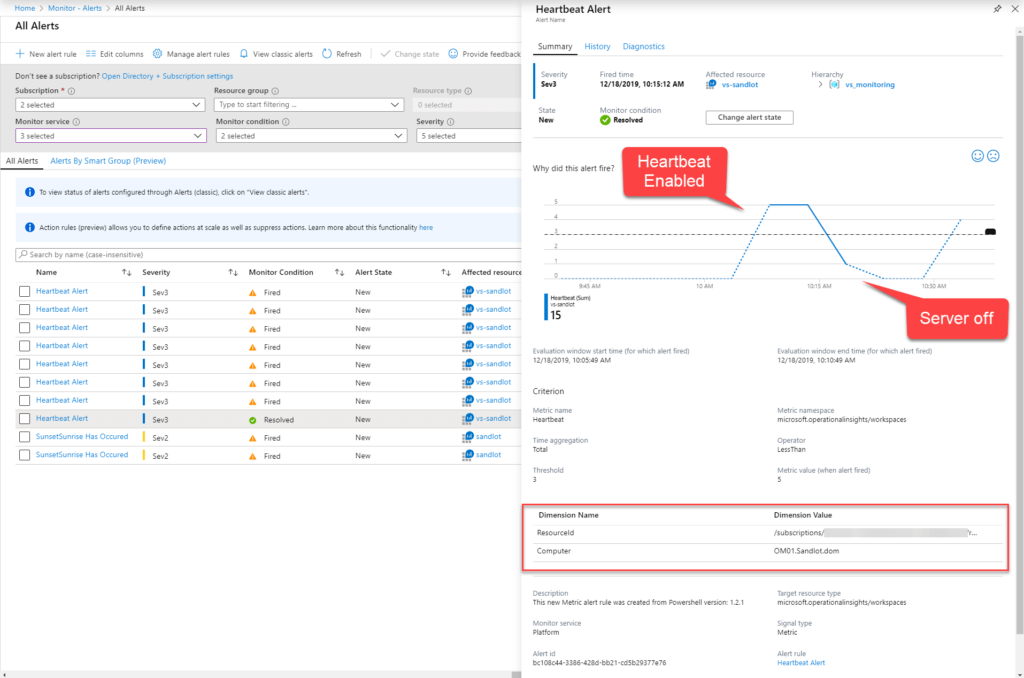
There are a few things going on with this alert. You can see where I enabled the alert, turned the server off and received the alert notification. Then the alert resolved itself once the server was back online.
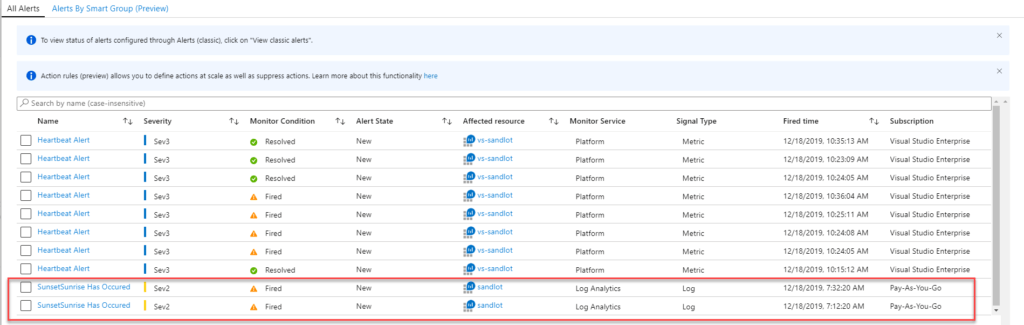
Compared to a log search alert I’ve created from my LogicApp that sends my sunrise data in, the alert alerted twice, because the record was found two times in the search interval that I’ve set for that alert. You can also see some of the other Heartbeat alerts resolved themselves as well.
Creating the Heartbeat alert against Log Analytics allows you to alert on Azure and on-prem VMs. Even if they haven’t been enabled for Azure Arc. All new machines added will be automatically be added via the Dimensions setting in the Alert. And the alerts are slightly faster than Log Search alerts.