If you’ve read my blog before then you probably know that Application Insights uses the same query language as Log Analytics and that Log Analytics are both services under the Azure Monitor name. So, why not delve a little into application monitoring? In this post I’ll show you how to monitor website availability. Along with some queries and alerts.
This post assumes you’ve already setup a Application Insights workspace. If you haven’t its really easy just follow the on screen prompts and select generic app if you don’t know what language your app is using.
Setup URL Monitor
Next, find the Availability tab and select Add test
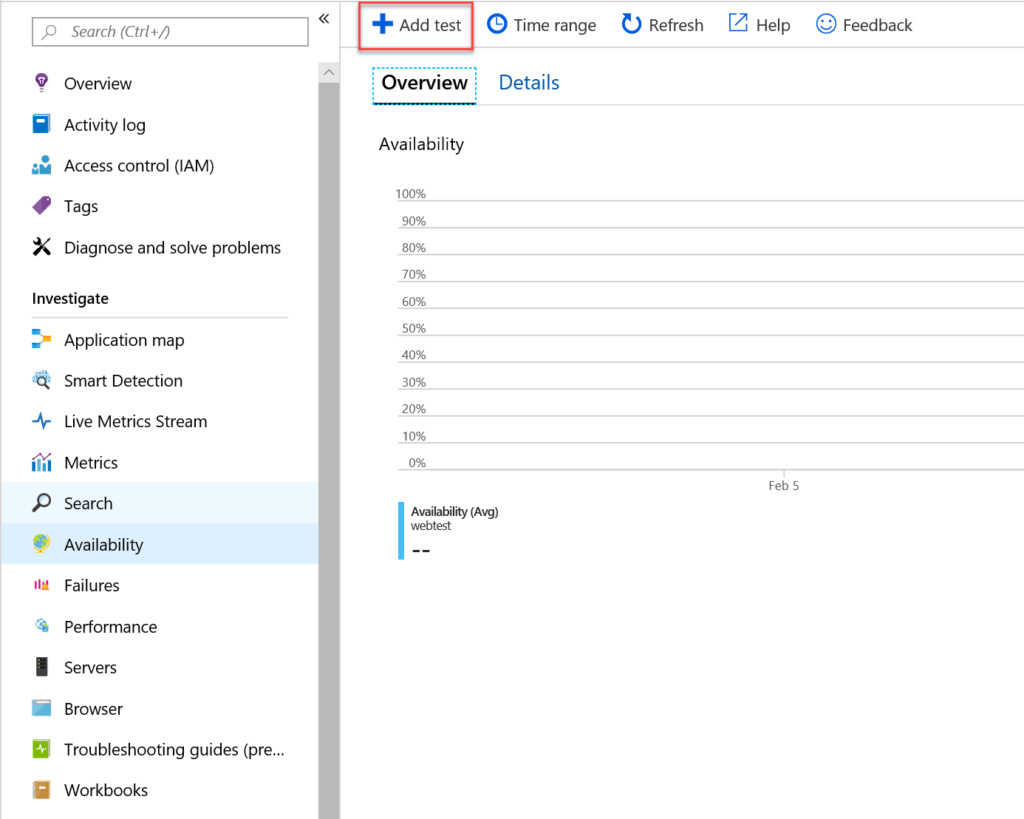
The single step test is completely free to setup. The multi-step does incur a charge. As always, for any billing always double check for yourself.
Give your test a name. Remember this name because its used in the queries for your monitoring data. I selected 5 locations from around the world, as I’m assuming my readers aren’t just from the US.
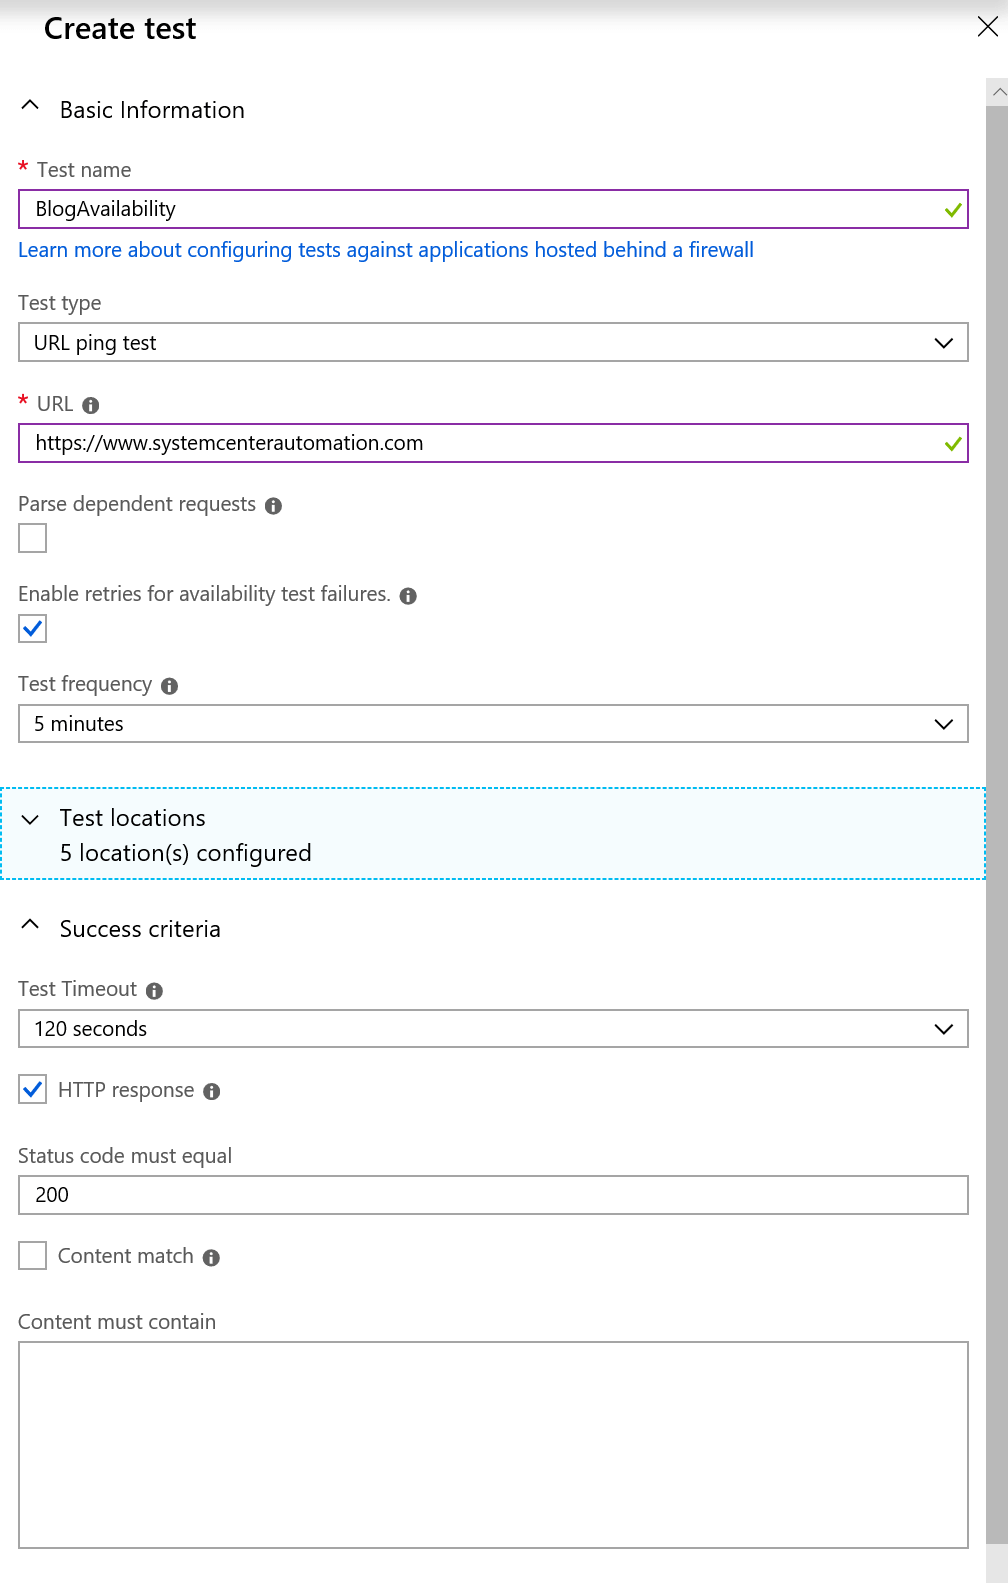
One thing to note here, at present you can only setup the monitor for a external facing website. Hopefully, at some point down the road we’ll be able to use something like the Log Analytics agent to setup monitors for internal only websites. Like we could in SCOM.
By default the test is setup to allow for alerts if a certain amount of test locations fail at the same time. 3 is the default. Fill in your email or a webhook if you want to enable the alert.
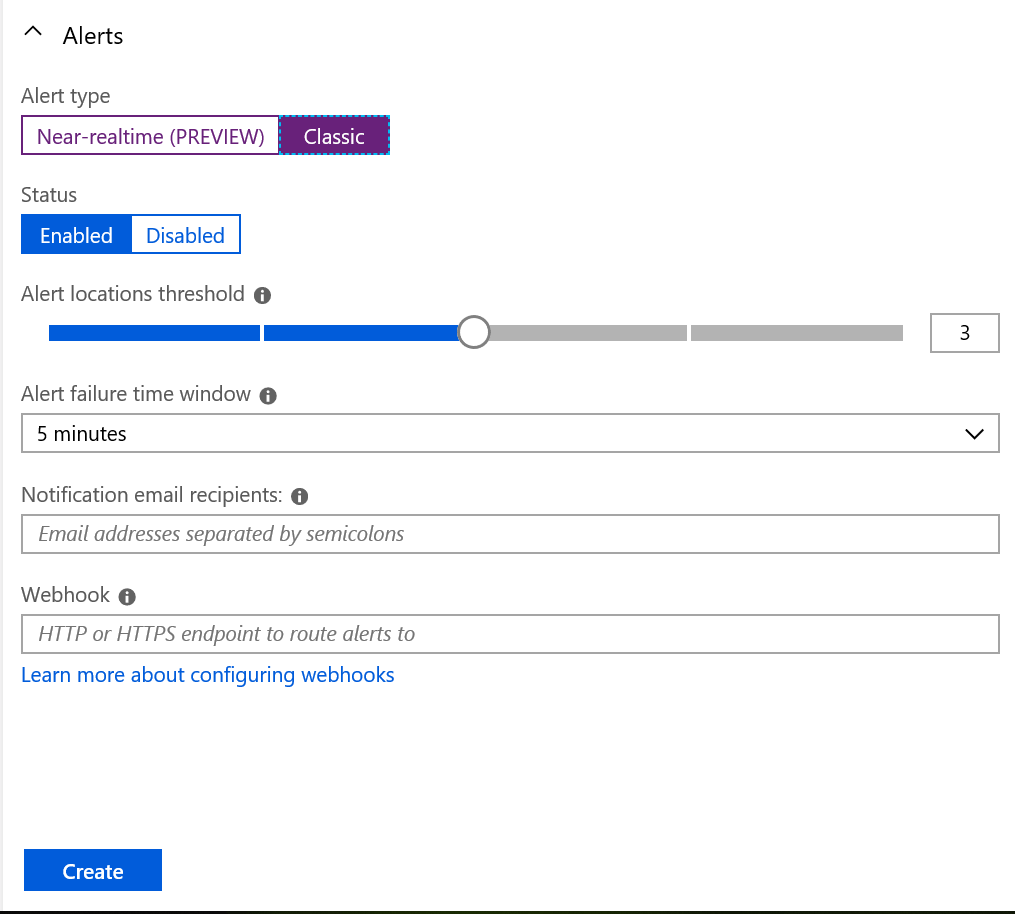
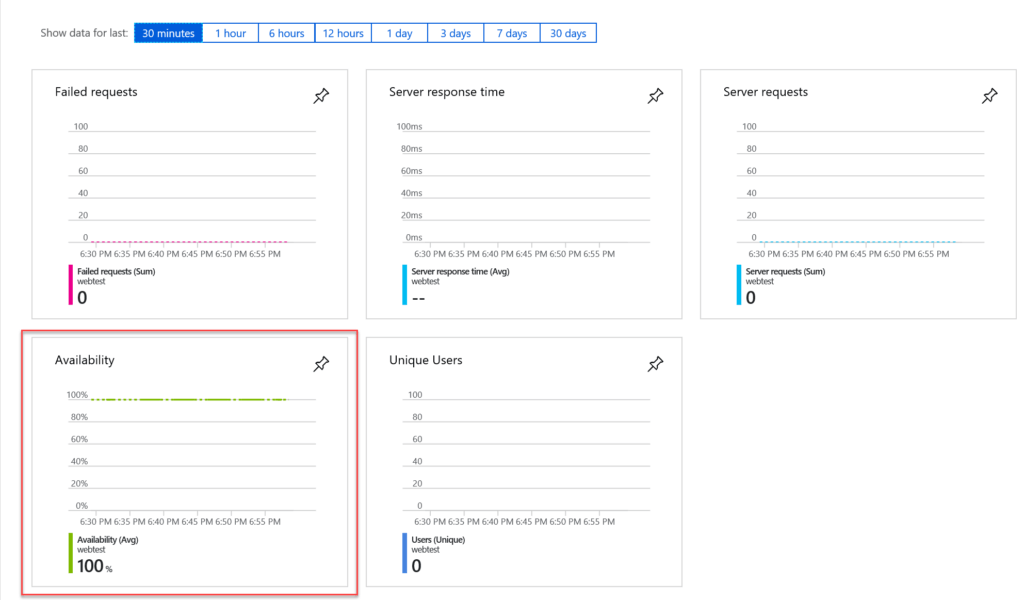
Click create and after a few minutes you’ll have data in the Availability widget.
Dashboards
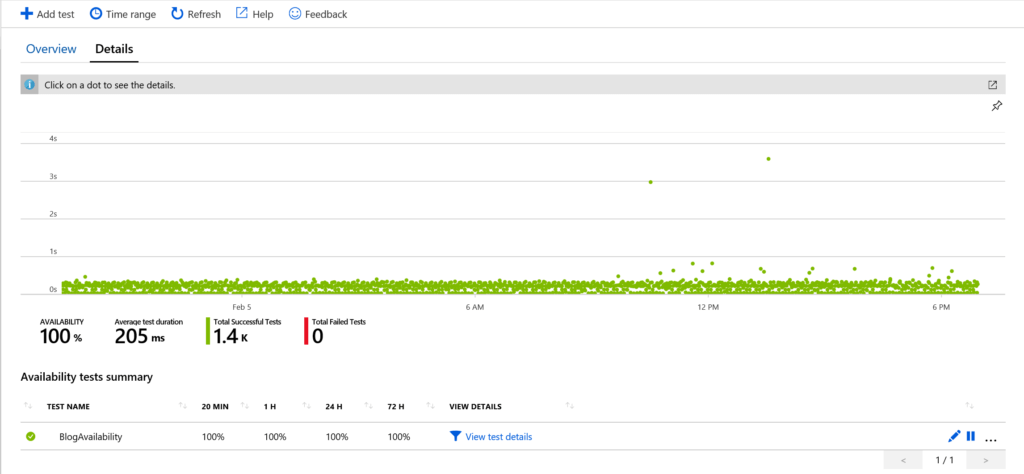
Clicking on the widget opens a broader dashboard. Selecting Details gives you far more information, like test duration, % available and the number of tests performed. You can also edit or pause the test in the bottom right.
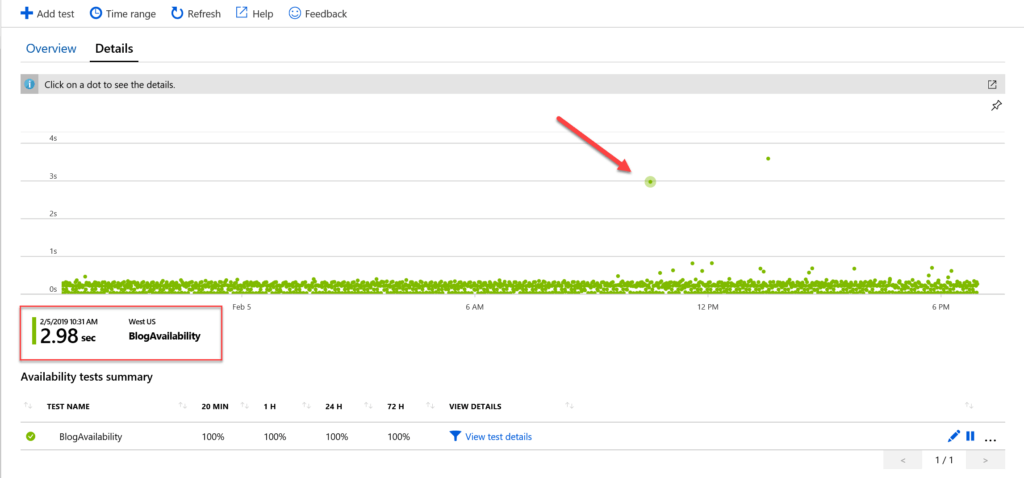
You can see I have a couple of outliers, hovering over one will show you the test duration and location.
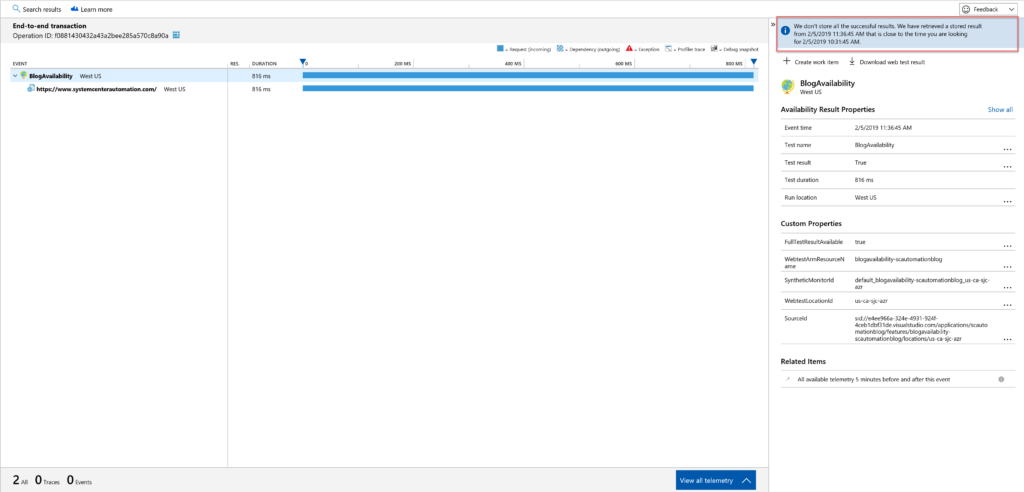
Clicking on it opens the end to end transaction details. Unfortunately this particular record was not found, so the engine brought me the next closest data it did have.
Logs
As mentioned previously Application Insights uses the same language as Log Analytics. You can get to the logs from the overview tab, as well as various places like the end to end transaction menu.
The URL tests are stored under the ‘availabilityResults’ table.
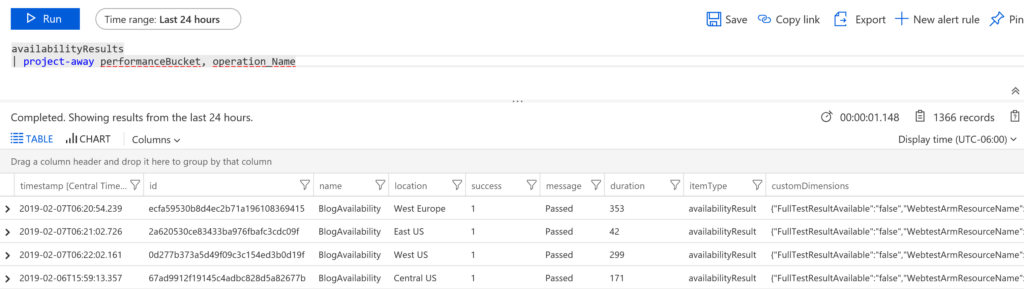
You can see under the name column, I have the BlogAvailability name I gave the test. This is useful if you have more than one test for different websites. You can name them appropriately for each one.
Using my favorite operator, we can generate different graphs or custom alerts. This scatter chart is an average of the duration by location. Central US and East US are the fastest locations to my blog, apparently.
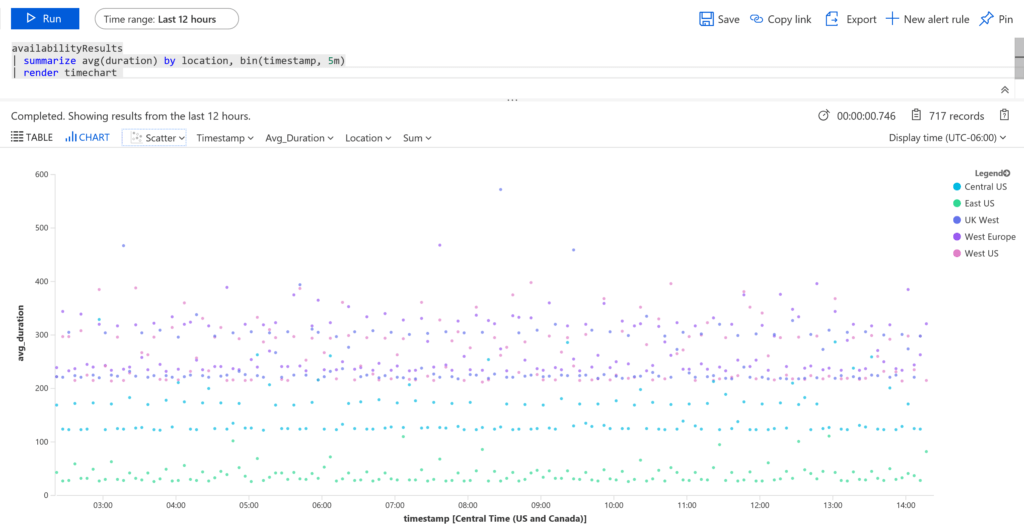
Or we can do a simple alert based on all 5 locations. Where the aggregate over the last 5 minutes is greater than 500ms
availabilityResults
| where timestamp > ago(5m)
| summarize Alert=avg(duration)
| where Alert > 500
Alerts
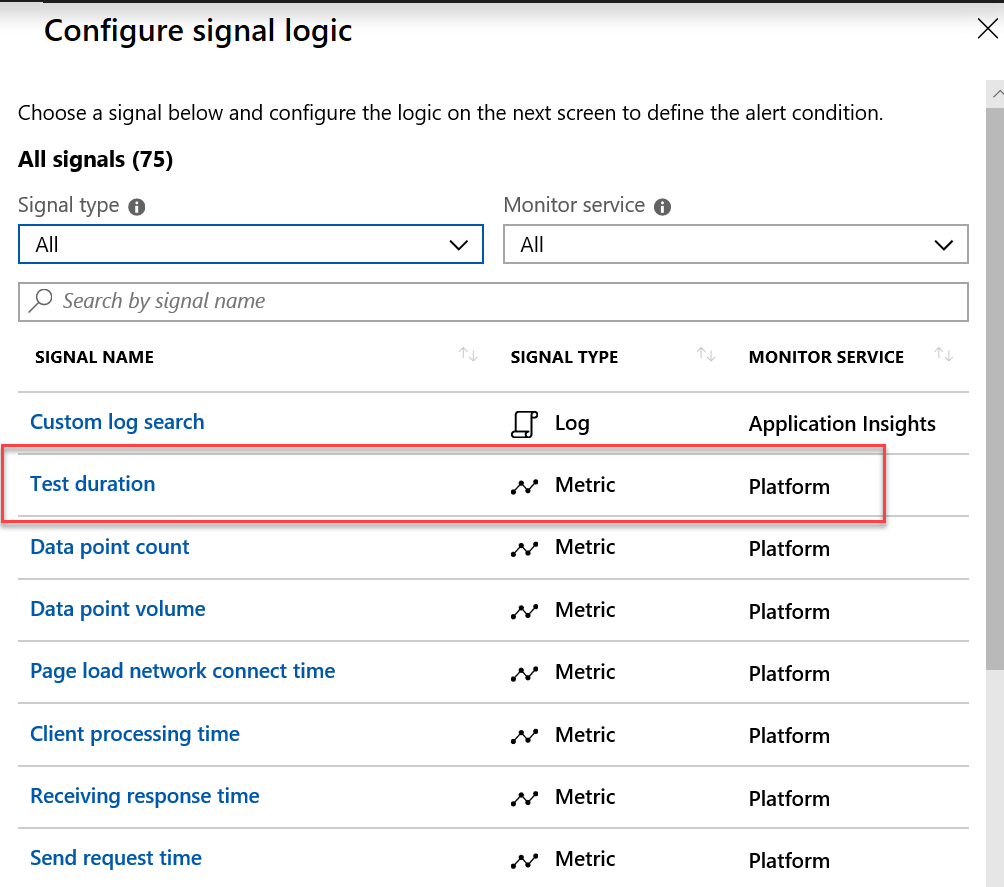
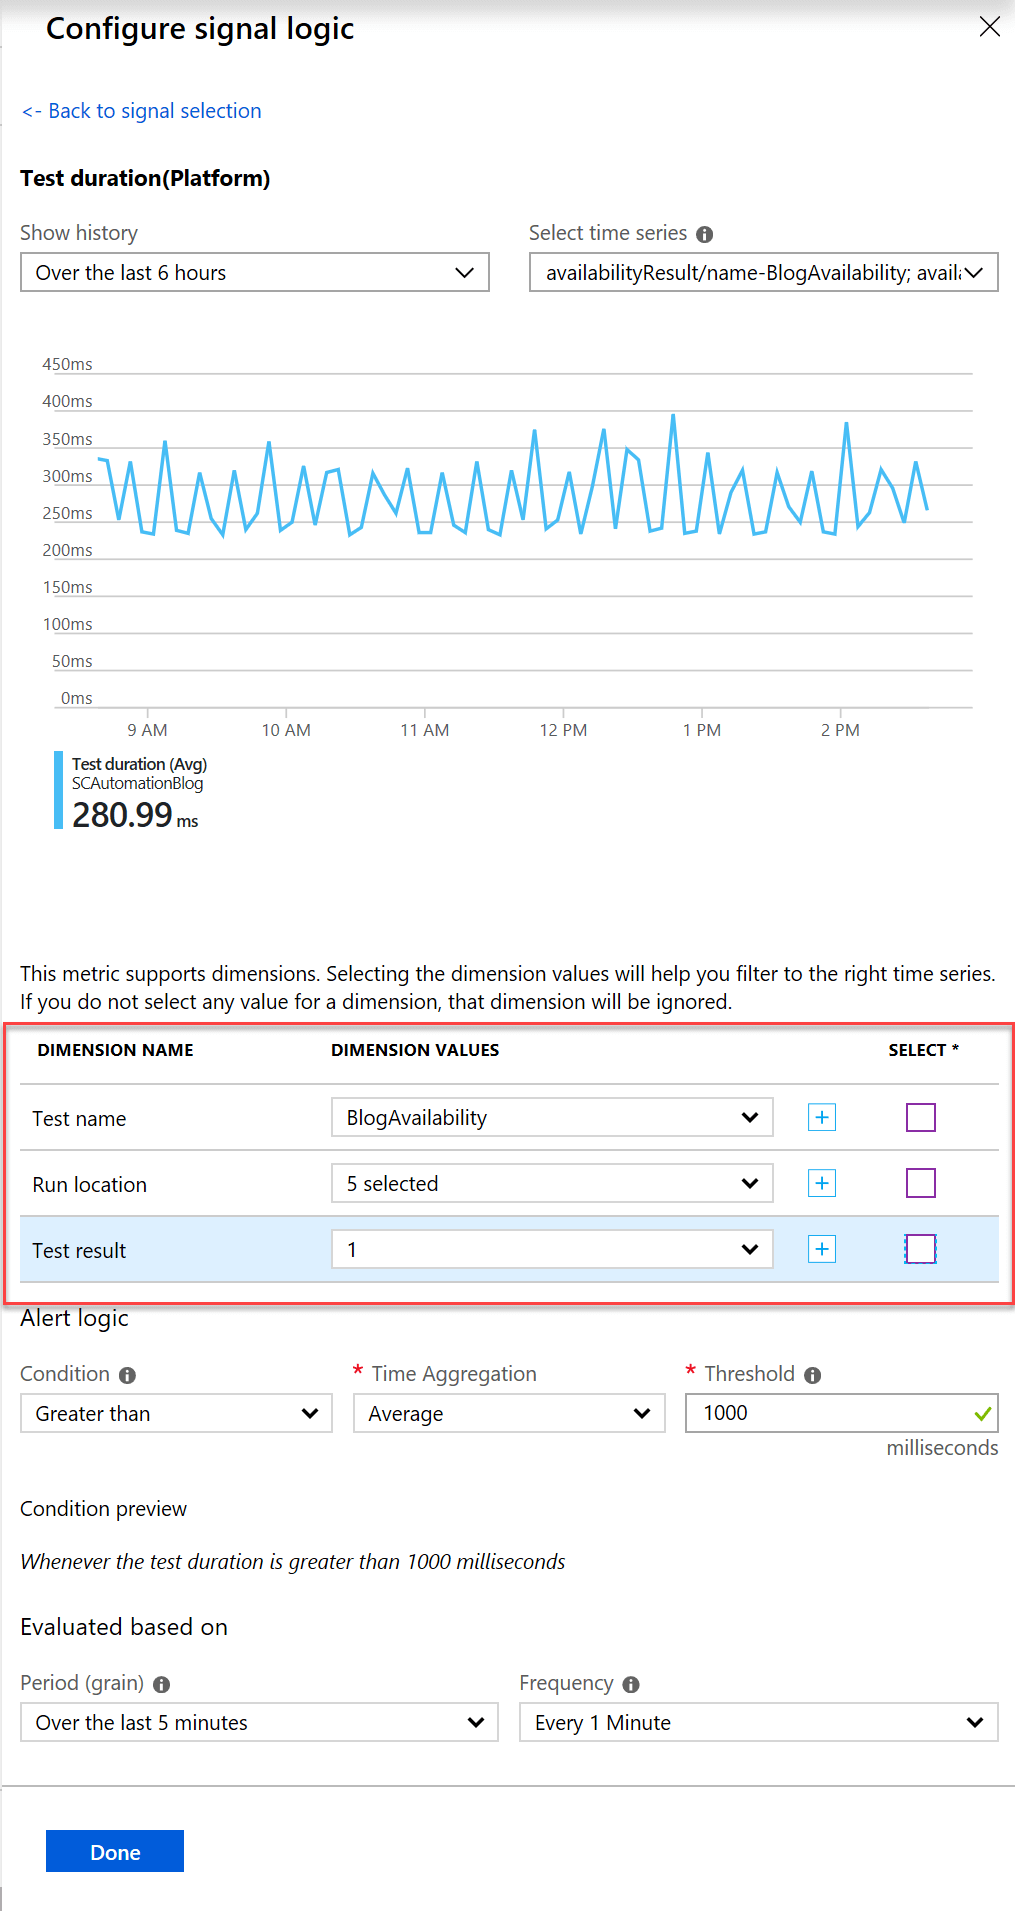
You can definitely create your own alert criteria if you want, using the Custom Log Search. That said the new unified alert experience in Azure has templates for this test already. After selecting the Application Insights workspace you’ve created as the Resource to pull from. We’ll use the Test duration template.
To configure, find your test name. In my case it was BlogAvailability. I also selected all 5 locations, because I want the aggregate of them. And because I already have an alert setup for if 3 out of 5 tests fail, I only want successful tests. The purpose being to alert me if my blog is slower than 1 second in response time from all 5 locations. Note: I un-selected the test name, run location and rest result, for the screen grab, they were greyed out after selecting them.
And that is how we can monitor website availability with Application Insights.
Want to learn more about Application Insights, check out my post on Application Performance Monitoring with Application Insights
2 thoughts on “Monitor Website Availability with Application Insights”
Comments are closed.