Staying on top of performance issues is a top priority for any ops team. When it comes to high CPU issues your monitoring solution may be able to tell you when CPU is high on any server. But beyond that you were then logging into the server to run perfmon or some other tool, or if you were really fancy maybe you had a diagnostic script that would run and report back. In this post I’ll show you how you can find high CPU processes in Azure Log Analytics.
Prerequisites
You’ll need to add the following performance counters:
Process(*)% Processor Time
Process(*)% User Time
Processor(*) % Processor Time
I have a post here that can help you with that. You don’t specifically need User Time for this post, however it may come in handy in other instances.
We’ll also be using a query from the UK Azure blog https://blogs.msdn.microsoft.com/ukhybridcloud/2017/12/13/azure-log-analytics-finding-cpus-with-perf-counters/
This post details how to get a CPU count for your machines reporting to Log Analytics.
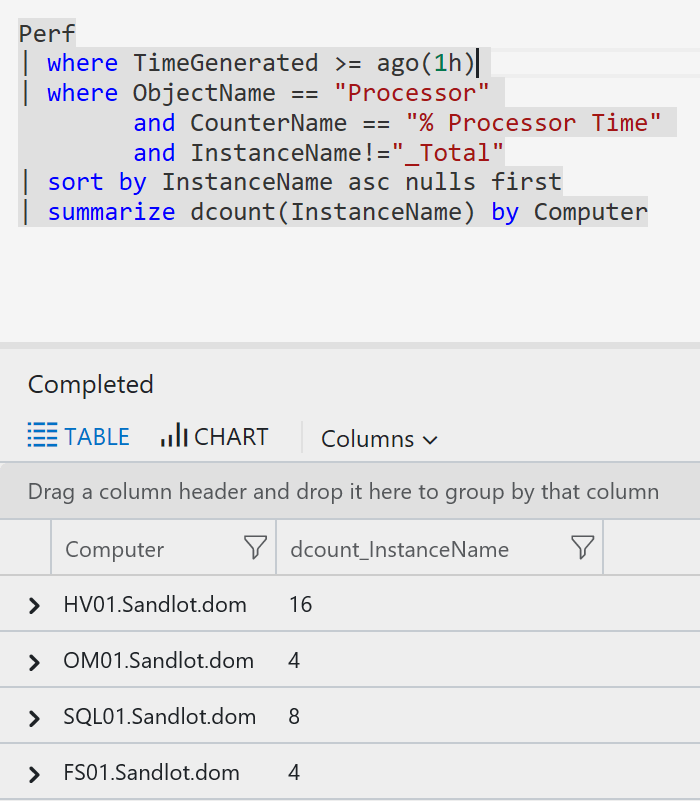
I changed the query a little for the main query we’ll be using, but here’ is what it shows. I’ll also be posting the queries for easy copy and paste.
Perf
| where TimeGenerated >= ago(1h)
| where ObjectName == "Processor"
              and CounterName == "% Processor Time"
              and InstanceName!="_Total"
| sort by InstanceName asc nulls first
| summarize dcount(InstanceName) by Computer
Finding CPU Processes
Perhaps you have a query that might look similar to this to find high CPU and alert on it.
Perf
| where CounterName == "% Processor Time"
              and CounterValue > 90
              and ObjectName == "Processor"
              and InstanceName == "_Total"
| distinct Computer
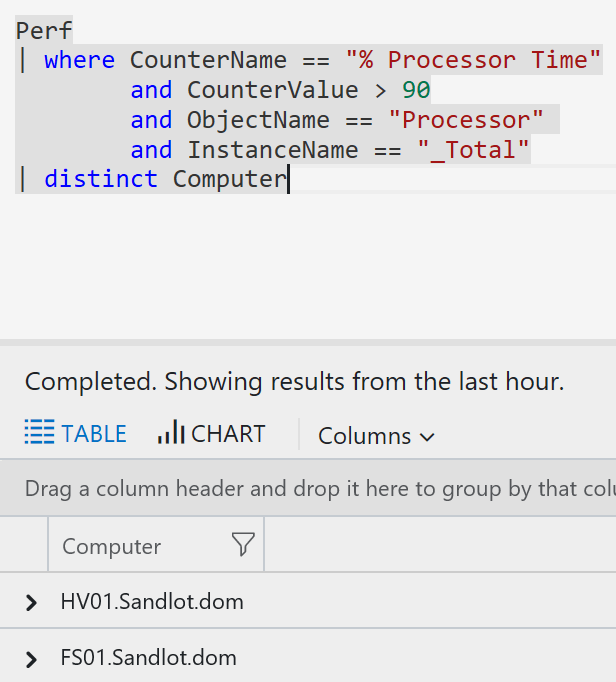
As you can see I have two machines with over 90% CPU usage.
To find what processes are using CPU we’re going to use our new counters mentioned above. Part of the counters includes a new ObjectName we can use call Process. You can find what Performance objects you have using the distinct operator, which I talk about here.
Perf
| where TimeGenerated > now(-60m)
              and ObjectName == "Process"
              and CounterName == "% Processor Time"
              and InstanceName != "_Total"
              and InstanceName != "Idle"
              and CounterValue > 50
This query finds all instance in the last hour, with the ObjectName of Process, Countername of % Processor Time, the instances name is not _Total or Idle, and the CounterValue is above 50. Note 50 in this instance is not a percentage, and you’ll see why in a minute.
Here are our results, great you can see we found the process, HandBrake, that’s taking up our CPU. But have a look at the counter value, 1492? Out of what? 1500? 2000?
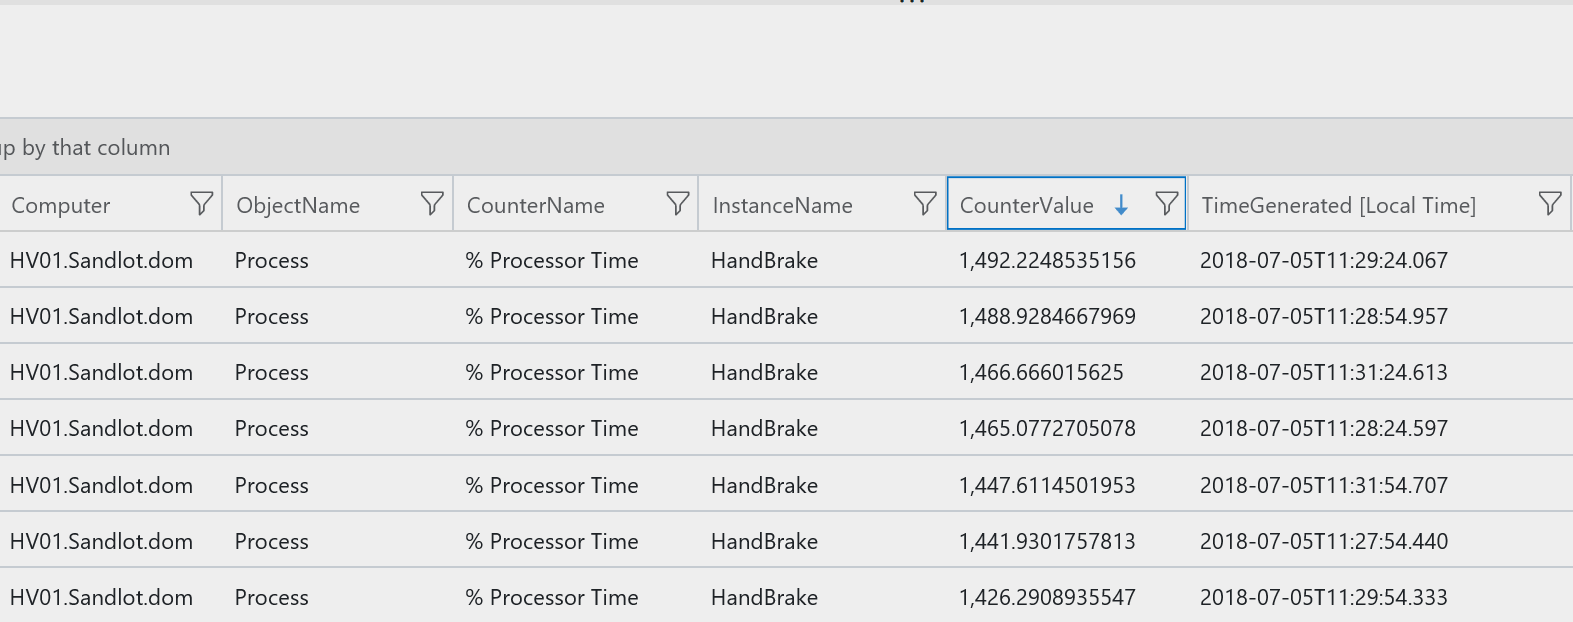
After some noodling on this, the CounterValue for Process is actually the total of all CPUs together. For instances if your server has 16 CPUs, then 100% is 1600. So, how can we dynamically adjust this to a percentage? Using the query above that gave us the CPU count, we can calculate the percentages after we do some joins.
The Full Query
//Find Top processes utilizing CPU
// by finding the machine(s) using over 90% of CPU
// then finding the processes using the CPU
// also finding CPU count of the machines to find the actual percentage of CPU being used

//defining our CPU threshold
let CPUThreshold = 90;

//define time sample rate
let Time = 10m;

//define Count of processes to return
let Count = 5;

//Find instances of total cpu being used above 90% over the last 10 minutes
let TopCPU = Perf
| where TimeGenerated > now(-Time)
              and ObjectName == "Processor"
              and CounterName == "% Processor Time"
              and InstanceName == "_Total"
              and CounterValue > CPUThreshold
| project Computer, ObjectName
              , CounterName, CounterValue
              , TimeGenerated;
//end query

// find top Processes, excluding _Total and Idle instances, there may be other instances you want to exclude as well
let TopProcess = Perf
| where TimeGenerated > now(-Time)
               and CounterName == "% Processor Time"
               and InstanceName != "_Total"
               and InstanceName != "Idle"
| project Computer, ObjectName
              , CounterName, InstanceName
              , CounterValue, TimeGenerated;
// end query

// find CPU count for servers(s)
let FindCPU = Perf
| where TimeGenerated >= ago(1h)
| where ObjectName == "Processor"
              and CounterName == "% Processor Time"
              and InstanceName!="_Total"
| sort by InstanceName asc nulls first
| summarize CPUCount = dcount(InstanceName) by Computer;
// end query

//Join all 3 datasets together
FindCPU | join(TopCPU) on Computer
| join(TopProcess)on Computer
| extend PercentProcessorUsed = CounterValue1 / CPUCount
| summarize avg(PercentProcessorUsed) by Computer, ObjectName
                  , CounterName, CPUCount
                  , TotalCPU=CounterValue //rename CounterValue to TotalCPU
                  , Process=ObjectName1 //rename ObjectName1 to Process
                  , ProcessTime=CounterName1 //rename CounterName1 to ProcessTime
                  , ProcessName=InstanceName //rename InstanceName to ProcessName
                  , TimeGenerated
| where Process == "Process"
and avg_PercentProcessorUsed > 25 // only return processes that are using more than 25%
| top Count by avg_PercentProcessorUsed desc
| project Computer, CPUCount
                , ProcessName , avg_PercentProcessorUsed
                , TotalCPU, Process
                , ProcessTime, TimeGenerated
If you have questions regarding joins Stefan Roth has a post here you can check out. Essentially what I have done is use the default inner unique join on all three datasets, joining them on computer as that is the only unique field between the three of them.
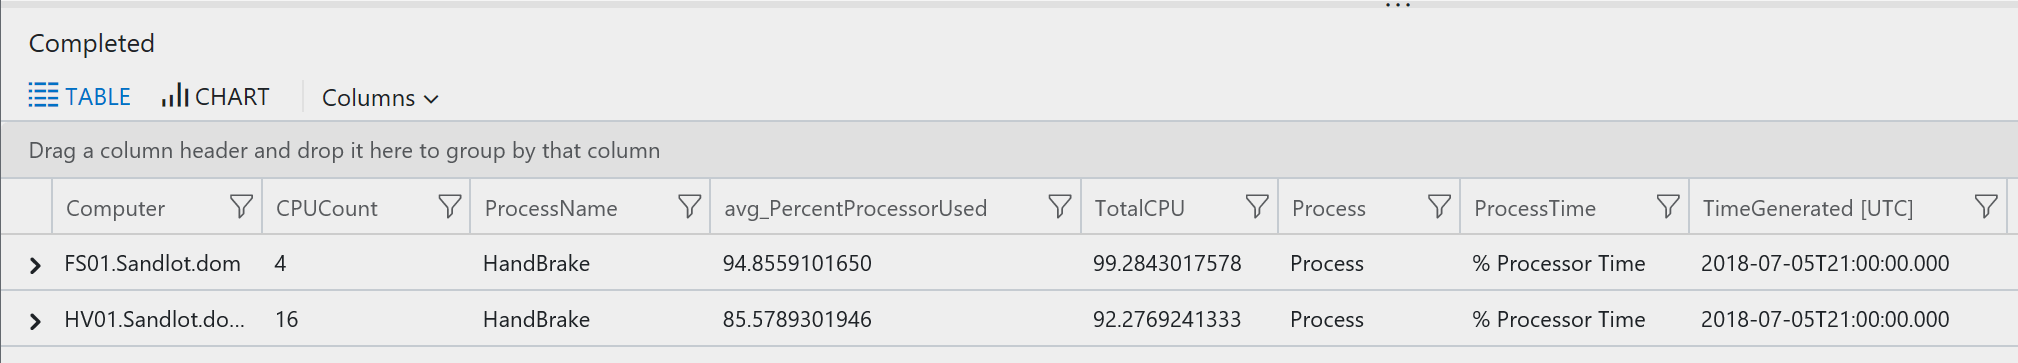
Our resultant dataset. We have two servers FS01, HV01 where someone is running HandBrake on them, gobbling up all the CPU. Test out my query in your environment, let me know how it works or if it needs modifications. Ideally I would have liked to make a function out of FindCPU, but I couldn’t quite figure out how to make the function work. I was getting back only the computer name and not the CPU count. So if you’ve made functions in Log Analytics, hit me up, I have questions.
Summary
To recap, what we have done is get all computers where the _Total CPU usage was over 90% in the last ten minutes. Then we found all the processes running in the last ten minutes and the CPU count for our servers. We then joined them all together, calculated the percentage of the process used by dividing by the CPU count, and then summarized the average. Most of the time, and thresholds are defined at the top of the query so you can adjust them as needed. No query is perfect, so try it out, play with it, the best way to learn the language is to jump right in.